Tyson Foods 2006 Annual Report Download - page 55
Download and view the complete annual report
Please find page 55 of the 2006 Tyson Foods annual report below. You can navigate through the pages in the report by either clicking on the pages listed below, or by using the keyword search tool below to find specific information within the annual report.-
 1
1 -
2
-
3
-
4
-
5
-
6
-
7
-
8
-
9
-
10
-
11
-
12
-
13
-
14
-
15
-
16
-
17
-
18
-
19
-
20
-
21
-
22
-
23
-
24
-
25
-
26
-
27
-
28
-
29
-
30
-
31
-
32
-
33
-
34
-
35
-
36
-
37
-
38
-
39
-
40
-
41
-
42
-
43
-
44
-
 45
45 -
 46
46 -
 47
47 -
 48
48 -
 49
49 -
 50
50 -
 51
51 -
 52
52 -
 53
53 -
 54
54 -
 55
55 -
 56
56 -
 57
57 -
 58
58 -
 59
59 -
 60
60 -
 61
61 -
 62
62 -
 63
63 -
 64
64 -
 65
65 -
66
-
67
-
68
 |
 |

• Prepared Foods segment includes the Company’s operations
that manufacture and market frozen and refrigerated food prod-
ucts. Products include pepperoni, beef and pork pizza toppings,
pizza crusts, flour and corn tortilla products, appetizers, prepared
meals, ethnic foods, soups, sauces, side dishes, meat dishes and
processed meats. The Prepared Foods segment markets its products
domestically to food retailers, foodservice distributors, restaurant
operators and noncommercial foodservice establishments such
as schools, hotel chains, healthcare facilities, the military and
other food processors, as well as to international markets
throughout the world.
• Other segment includes the logistics group and other miscella-
neous operations.
Ty s on Foods, Inc. 2006 Annual Report53
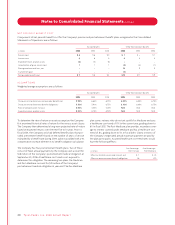
Notes to Consolidated Financial Statements continued
Prepared
in millions Chicken Beef Pork Foods Other Consolidated
Fiscal year ended September 30, 2006
Sales $7,928 $11,825 $3,060 $2,692 $54 $25,559
Operating income (loss) 53 (296) 47 45 74 (77)
Other expense 216
Loss before income taxes (293)
Income tax benefit (102)
Loss before cumulative effect of change in accounting principle (191)
Cumulative effect of change in accounting principle, net of tax 5
Depreciation 222 106 30 60 63 481
Total assets 4,325 3,271 833 1,006 1,686 11,121
Additions to property, plant and equipment 219 135 13 54 110 531
Fiscal year ended October 1, 2005
Sales $8,295 $11,618 $3,247 $2,801 $ 53 $ 26,014
Operating income (loss) 582 (12) 47 78 50 745
Other expense 217
Income before income taxes 528
Depreciation 241 111 31 65 17 465
Total assets 4,398 3,243 834 1,107 922 10,504
Additions to property, plant and equipment 321 165 23 55 7 571
Fiscal year ended October 2, 2004
Sales $8,363 $11,951 $3,185 $2,891 $ 51 $ 26,441
Operating income 548 127 140 28 74 917
Other expense 282
Income before income taxes 635
Depreciation 239 106 30 66 17 458
Total assets 4,556 3,195 895 970 848 10,464
Additions to property, plant and equipment 298 90 22 61 15 486
The Pork segment had sales of $467 million, $505 million and
$473 million for fiscal years 2006, 2005 and 2004, respectively,
from transactions with other operating segments of the Company.
The Beef segment had sales of $104 million, $85 million and
$75 million for fiscal years 2006, 2005 and 2004, respectively, from
transactions with other operating segments of the Company. These
sales from intersegment transactions, which are sold at market
prices, were excluded from the segment sales in the above table.
The Company’s largest customer, Wal-Mart Stores, Inc., accounted
for approximately 12.5%, 13.0% and 11.6% of consolidated sales in
fiscal years 2006, 2005 and 2004, respectively. Sales to Wal-Mart
Stores, Inc. were included in the Chicken, Beef, Pork and Prepared
Foods segments. Any extended discontinuance of sales to this
customer could, if not replaced, have a material impact on the
Company’s operations; however, the Company does not anticipate
any such occurrences.