Tyson Foods 2006 Annual Report Download - page 43
Download and view the complete annual report
Please find page 43 of the 2006 Tyson Foods annual report below. You can navigate through the pages in the report by either clicking on the pages listed below, or by using the keyword search tool below to find specific information within the annual report.-
 1
1 -
2
-
3
-
4
-
5
-
6
-
7
-
8
-
9
-
10
-
11
-
12
-
13
-
14
-
15
-
16
-
17
-
18
-
19
-
20
-
21
-
22
-
23
-
24
-
25
-
26
-
27
-
28
-
29
-
30
-
31
-
32
-
 33
33 -
 34
34 -
 35
35 -
 36
36 -
 37
37 -
 38
38 -
 39
39 -
 40
40 -
 41
41 -
 42
42 -
 43
43 -
 44
44 -
 45
45 -
 46
46 -
 47
47 -
 48
48 -
 49
49 -
 50
50 -
 51
51 -
 52
52 -
 53
53 -
54
-
55
-
56
-
57
-
58
-
59
-
60
-
61
-
62
-
63
-
64
-
65
-
66
-
67
-
68
 |
 |

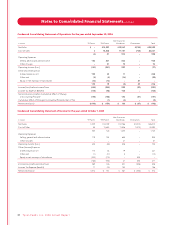
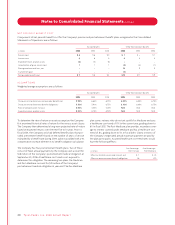
Condensed Consolidating Statement of Cash Flows for the year ended September 30, 2006
Non-Guarantor
in millions TFI Parent TFM Parent Subsidiaries Eliminations Total
Cash Flows From Operating Activities:
Net income (loss) $(196) $(159) $ 186 $(27) $ (196)
Depreciation and amortization 33 138 346 – 517
Plant closing related charges – 38 13 – 51
Impairment and write-down of assets – 3 15 – 18
Equity in net earnings of subsidiaries (14) (13) – 27 –
Dividends received 60 – – (60) –
Cumulative effect of change in accounting principle, before tax – 2 7 – 9
Deferred taxes and other 9 (46) (114) – (151)
Net changes in working capital 210 111 (282) – 39
Cash Provided by Operating Activities 102 74 171 (60) 287
Cash Flows From Investing Activities:
Additions to property, plant and equipment (81) (153) (297) – (531)
Purchases of marketable securities (750) – (191) – (941)
Proceeds of marketable securities – – 214 – 214
Other, net 29 (15) 20 – 34
Cash Used for Investing Activities (802) (168) (254) – (1,224)
Cash Flows From Financing Activities:
Payments of debt, net 95 (101) (2) – (8)
Net proceeds from borrowings of debt 992 – – – 992
Purchase of treasury shares (42) – – – (42)
Dividends (55) – (60) 60 (55)
Stock options exercised and other 32 (6) 16 – 42
Net change in intercompany balances (326) 201 125 – –
Cash Provided by Financing Activities 696 94 79 60 929
Effect of Exchange Rate Change on Cash – – (4) – (4)
Decrease in Cash and Cash Equivalents (4) – (8) – (12)
Cash and Cash Equivalents at Beginning of Year 6 1 33 – 40
Cash and Cash Equivalents at End of Year $ 2 $ 1 $ 25 $ – $ 28
Ty s o n F o o d s , I n c . 2 0 0 6 A n n u a l R e p o r t 41
Notes to Consolidated Financial Statements continued