Tyson Foods 2006 Annual Report Download - page 51
Download and view the complete annual report
Please find page 51 of the 2006 Tyson Foods annual report below. You can navigate through the pages in the report by either clicking on the pages listed below, or by using the keyword search tool below to find specific information within the annual report.-
 1
1 -
2
-
3
-
4
-
5
-
6
-
7
-
8
-
9
-
10
-
11
-
12
-
13
-
14
-
15
-
16
-
17
-
18
-
19
-
20
-
21
-
22
-
23
-
24
-
25
-
26
-
27
-
28
-
29
-
30
-
31
-
32
-
33
-
34
-
35
-
36
-
37
-
38
-
39
-
40
-
 41
41 -
 42
42 -
 43
43 -
 44
44 -
 45
45 -
 46
46 -
 47
47 -
 48
48 -
 49
49 -
 50
50 -
 51
51 -
 52
52 -
 53
53 -
 54
54 -
 55
55 -
 56
56 -
 57
57 -
 58
58 -
 59
59 -
 60
60 -
 61
61 -
62
-
63
-
64
-
65
-
66
-
67
-
68
 |
 |

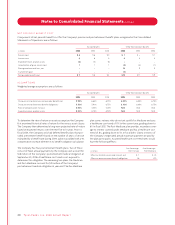
PLAN ASSETS
The fair value of plan assets for the Company’s domestic union
pension benefit plans was $71 million and $70 million as of
September 30, 2006, and October 1, 2005, respectively. The
following table sets forth the actual and target asset allocation
for the Company’s pension plan assets:
Target Asset
2006 2005 Allocation
Cash 1.6% 0.7% 0.0%
Fixed income securities 24.624.6 25.0
US Stock Funds – Large- and Mid-Cap 49.349.7 50.0
US Stock Funds – Small-Cap 9.8 10.0 10.0
International Stock Funds 14.715.0 15.0
Total 100.0% 100.0% 100.0%
During fiscal 2005, the Company recorded the assets and benefit
obligation related to a foreign subsidiary. This pension plan had
$14 million and $12 million in plan assets at September 30, 2006,
and October 1, 2005, respectively. All of this plan’s assets are held
in annuity contracts consistent with its target asset allocation.
The Plan Trustees have established a set of investment objectives
related to the assets of the pension plans and regularly monitor the
performance of the funds and portfolio managers. Objectives for
the pension assets are (1) to provide growth of capital and income,
(2) to achieve a target weighted average annual rate of return
competitive with other funds with similar investment objectives
and (3) to diversify to reduce risk. The investment objectives and
target asset allocation were updated in January 2004.
CONTRIBUTIONS
The Company’s policy is to fund at least the minimum contribution
required to meet applicable federal employee benefit and local tax
laws. In its sole discretion, the Company may from time to time fund
additional amounts. Expected contributions to the Company’s
pension plans for fiscal 2007 are approximately $5 million. For
fiscal 2006, 2005 and 2004, the Company funded $0, $10 million
and $9 million, respectively, to its defined benefit plans.
ESTIMATED FUTURE BENEFIT PAYMENTS
The following benefit payments are expected to be paid:
Other
Pension Postretirement
in millions BenefitsBenefits
2007 $ 7 $15
2008 7 15
2009 8 15
2010 9 15
2011 9 15
2012-2016 59 78
The above benefit payments for other postretirement benefit plans
are expected to be offset by Medicare Part D subsidies as follows:
$1 million in 2007, $1 million in 2008, $1 million in 2009, $2 million
in 2010, $2 million in 2011 and $12 million from 2012 to 2016.
NOTE 13 SUPPLEMENTAL CASH FLOW INFORMATION
Certain non-cash transactions were excluded from the Consoli-
dated Statements of Cash Flows for fiscal 2006. Adjustments of
$12 million were made, which increased the balance of goodwill.
These adjustments primarily related to deferred tax asset and
liability adjustments related to the acquisitions in previous years
of TFM and the assets of Millard Processing Services.
In fiscal 2005, adjustments of $53 million were made to remove pre-
acquisition tax liability accruals no longer necessary due to the closing
of an IRS examination and the evaluation of certain pre-acquisition
deferred tax liabilities. The adjustments include $46 million and
$7 million of adjustments to pre-acquisition deferred tax assets
and liabilities related to the acquisitions in previous years of TFM
and Hudson Foods, Inc., respectively.
The following table summarizes cash payments for interest and
income taxes:
in millions 2006 2005 2004
Interest $140 $218 $316
Income taxes, net of refunds 144 107 244
Ty s on Foods, Inc. 2006 Annual Report49
Notes to Consolidated Financial Statements continued