Tyson Foods 2006 Annual Report Download - page 41
Download and view the complete annual report
Please find page 41 of the 2006 Tyson Foods annual report below. You can navigate through the pages in the report by either clicking on the pages listed below, or by using the keyword search tool below to find specific information within the annual report.-
 1
1 -
2
-
3
-
4
-
5
-
6
-
7
-
8
-
9
-
10
-
11
-
12
-
13
-
14
-
15
-
16
-
17
-
18
-
19
-
20
-
21
-
22
-
23
-
24
-
25
-
26
-
27
-
28
-
29
-
30
-
 31
31 -
 32
32 -
 33
33 -
 34
34 -
 35
35 -
 36
36 -
 37
37 -
 38
38 -
 39
39 -
 40
40 -
 41
41 -
 42
42 -
 43
43 -
 44
44 -
 45
45 -
 46
46 -
 47
47 -
 48
48 -
 49
49 -
 50
50 -
 51
51 -
52
-
53
-
54
-
55
-
56
-
57
-
58
-
59
-
60
-
61
-
62
-
63
-
64
-
65
-
66
-
67
-
68
 |
 |

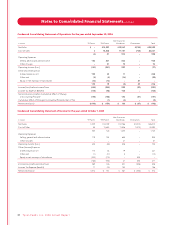
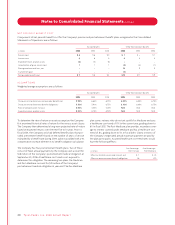
Condensed Consolidating Statement of Income for the year ended October 2, 2004
Non-Guarantor
in millions TFI Parent TFM Parent Subsidiaries Eliminations Total
Net Sales $ 329 $14,240 $12,953 $(1,081) $26,441
Cost of Sales (45) 13,970 11,714 (1,081) 24,558
374 270 1,239 – 1,883
Operating Expenses:
Selling, general and administrative 75 154 651 – 880
Other charges – – 86 – 86
Operating Income 299 116 502 – 917
Other (Income) Expense:
Interest expense, net 201 37 37 – 275
Other, net – (2) 9 – 7
Equity in net earnings of subsidiaries (341) (128) – 469 –
(140) (93) 46 469 282
Income (Loss) before Income Taxes 439 209 456 (469) 635
Income Tax Expense 36 29 167 – 232
Net Income (Loss) $ 403 $ 180 $ 289 $ (469) $ 403
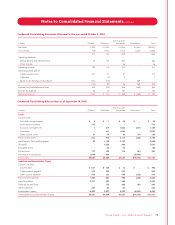
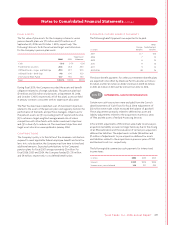
Condensed Consolidating Balance Sheet as of September 30, 2006
Non-Guarantor
in millions TFI Parent TFM Parent Subsidiaries Eliminations Total
Assets
Current Assets:
Cash and cash equivalents $ 2 $ 1 $ 25 $ – $ 28
Short-term investment 770 – – – 770
Accounts receivable, net 3 219 1,562 (601) 1,183
Inventories – 611 1,446 – 2,057
Other current assets 37 79 84 (51) 149
Total Current Assets 812 910 3,117 (652) 4,187
Net Property, Plant and Equipment 93 1,120 2,732 – 3,945
Goodwill – 1,526 986 – 2,512
Intangible Assets – 60 76 – 136
Other Assets 177 129 116 (81) 341
Investment in subsidiaries 7,899 944 – (8,843) –
Total Assets $8,981 $4,689 $7,027 $(9,576) $11,121
Liabilities and Shareholders’ Equity
Current Liabilities:
Current debt $ 851 $ 125 $ 16 $ – $ 992
Trade accounts payable 200 303 439 – 942
Other current liabilities 912 153 499 (652) 912
Total Current Liabilities 1,963 581 954 (652) 2,846
Long-Term Debt 2,371 257 359 – 2,987
Deferred Income Taxes – 178 398 (81) 495
Other Liabilities 207 80 66 – 353
Shareholders’ Equity 4,440 3,593 5,250 (8,843) 4,440
Total Liabilities and Shareholders’ Equity $8,981 $4,689 $7,027 $(9,576) $11,121
Ty s o n F o o d s , I n c . 2 0 0 6 A n n u a l R e p o r t 39
Notes to Consolidated Financial Statements continued