Tyson Foods 2006 Annual Report Download - page 15
Download and view the complete annual report
Please find page 15 of the 2006 Tyson Foods annual report below. You can navigate through the pages in the report by either clicking on the pages listed below, or by using the keyword search tool below to find specific information within the annual report.-
 1
1 -
2
-
3
-
4
-
 5
5 -
 6
6 -
 7
7 -
 8
8 -
 9
9 -
 10
10 -
 11
11 -
 12
12 -
 13
13 -
 14
14 -
 15
15 -
 16
16 -
 17
17 -
 18
18 -
 19
19 -
 20
20 -
 21
21 -
 22
22 -
 23
23 -
 24
24 -
 25
25 -
26
-
27
-
28
-
29
-
30
-
31
-
32
-
33
-
34
-
35
-
36
-
37
-
38
-
39
-
40
-
41
-
42
-
43
-
44
-
45
-
46
-
47
-
48
-
49
-
50
-
51
-
52
-
53
-
54
-
55
-
56
-
57
-
58
-
59
-
60
-
61
-
62
-
63
-
64
-
65
-
66
-
67
-
68
 |
 |

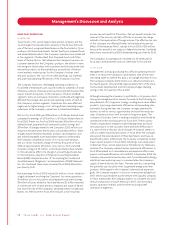
Sales by Segment
Average
Volume Price
in millions 2006 2005 ChangeChangeChange
Chicken $7,928 $8,295 $(367) 3.0% (7.2)%
Beef 11,825 11,618 207 2.6% (0.8)%
Pork 3,060 3,247 (187) 0.5% (6.2)%
Prepared Foods 2,692 2,801 (109) 0.3% (4.2)%
Other 54 53 1 N/A N/A
Total $25,559 $26,014 $(455) 2.3% (3.9)%
Operating Income (Loss) by Segment
Margin Margin
in millions 2006 2005 Change2006 2005
Chicken $53 $582 $(529) 0.7% 7.0%
Beef (296) (12) (284) (2.5)% (0.1)%
Pork 47 47 – 1.5% 1.4%
Prepared Foods 45 78 (33) 1.7% 2.8%
Other 74 50 24 N/A N/A
Total $ (77) $745 $(822) (0.3)% 2.9%
• Chicken segment sales decreased 4.4% and operating results
decreased $529 million in fiscal 2006 compared to fiscal 2005.
Fiscal 2006 operating results include charges of $9 million related
to the Company’s cost reduction initiative, other business consoli-
dation efforts and plant closing costs. Fiscal 2005 operating results
include $12 million of plant closing costs and $8 million of hurricane-
related losses. The decline in sales and operating results primarily
was due to lower average sales prices, predominantly caused by
an oversupply of proteins in the marketplace. Additionally, the
Chicken segment’s operating results were affected negatively by
higher energy costs and decreased margins at the Company’sopera-
tions in Mexico. Fiscal 2006 chicken operating results include
realized and unrealized net gains of $6 million from the Company’s
commodity risk management activities related to grain purchases
compared to realized and unrealized net losses of $27 million
recorded in fiscal 2005.
• Beef segment sales increased 1.8% and operating results decreased
$284 million in fiscal 2006 compared to fiscal 2005. Fiscal 2006
operating results include charges of $52 million related to plant
closing costs, the Company’s cost reduction initiative and other
business consolidation efforts. Fiscal 2005 operating results include
$10 million received in connection with vitamin antitrust litigation.
The operating results decline primarily was due to lower average
sales prices, predominantly caused by an oversupply of proteins in
the marketplace. Additionally, the Beef segment’s operating results
were affected negatively by significant operating margin reductions
at the Company’s Lakeside operation in Canada. Also, fiscal 2006
operating results include realized and unrealized net losses of
$40 million from the Company’s commodity risk management
activities related to its fixed forward boxed beef sales and forward
live cattle purchases, compared to realized and unrealized net
gains of $13 million recorded in fiscal 2005.
• Pork segment sales decreased 5.8% and operating results remained
flat in fiscal 2006 compared to fiscal 2005. Fiscal 2006 operating
results include charges of $2 million related to the Company’s cost
reduction initiative and other business consolidation efforts. Fiscal
2005 operating results include $33 million related to a legal settle-
ment involving the Company’s live swine operations and $2 million
received in connection with vitamin antitrust litigation. Lower aver-
age sales prices, predominantly caused by an oversupply of proteins
in the marketplace adversely affected sales and operating results.
The lower average sales prices were offset partially by lower average
live prices. Additionally, fiscal 2006 operating results include realized
and unrealized net losses of $15 million from the Company’s commod-
ity risk management activities related to its fixed forward boxed
pork sales and forward live hog purchases, compared to realized
and unrealized net losses of $22 million recorded in fiscal 2005.
• Prepared Foods segment sales decreased 3.9% and operating
results decreased $33 million in fiscal 2006 compared to fiscal
2005. Fiscal 2006 operating results include charges of $19 million
related to plant closing costs, other business consolidation efforts
and the Company’s cost reduction initiative. Fiscal 2005 operating
results include $2 million related to plant closing costs. The decline
in sales and operating income primarily was due to lower average
sales prices.
2005 VS. 2004
Certain reclassifications have been made to prior periods to conform
to current presentations.
• Sales decreased $427 million or 1.6%, with a 0.7% increase in
average sales price and a 2.3% decrease in volume. The decrease
in sales primarily was due to reduced sales in the Company’s Beef
segment, resulting from the effects of import and export restric-
tions. Additionally, sales were affected negatively by decreased
sales volumes in each of the Company’s protein segments, pri-
marily due to one less week of sales in fiscal 2005. These declines
were offset partially by higher average sales prices in the Company’s
Chicken, Pork and Prepared Foods segments.
• Cost of Sales decreased $264 million or 1.1%. As a percent of sales,
cost of sales increased from 92.9% to 93.4%. The decrease in cost of
sales primarily was due to decreased grain costs of approximately
$312 million in fiscal 2005 compared to fiscal 2004, partially offset
by higher live costs in the Pork segment, higher raw material costs in
the Prepared Foods segment and higher energy costs. Additionally, the
Chicken segment recorded realized and unrealized losses of $27 mil-
lion in fiscal 2005 resulting from the Company’s commodity risk
management activities related to grain purchases, compared to
Ty s on Foods, Inc. 2006 Annual Report13
Management’s Discussion and Analysiscontinued