Tyson Foods 2006 Annual Report Download - page 46
Download and view the complete annual report
Please find page 46 of the 2006 Tyson Foods annual report below. You can navigate through the pages in the report by either clicking on the pages listed below, or by using the keyword search tool below to find specific information within the annual report.-
 1
1 -
2
-
3
-
4
-
5
-
6
-
7
-
8
-
9
-
10
-
11
-
12
-
13
-
14
-
15
-
16
-
17
-
18
-
19
-
20
-
21
-
22
-
23
-
24
-
25
-
26
-
27
-
28
-
29
-
30
-
31
-
32
-
33
-
34
-
35
-
 36
36 -
 37
37 -
 38
38 -
 39
39 -
 40
40 -
 41
41 -
 42
42 -
 43
43 -
 44
44 -
 45
45 -
 46
46 -
 47
47 -
 48
48 -
 49
49 -
 50
50 -
 51
51 -
 52
52 -
 53
53 -
 54
54 -
 55
55 -
 56
56 -
57
-
58
-
59
-
60
-
61
-
62
-
63
-
64
-
65
-
66
-
67
-
68
 |
 |

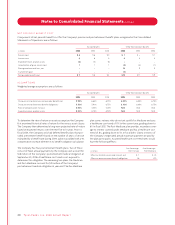
NOTE 10 COMPREHENSIVE INCOME (LOSS)
The components of accumulated other comprehensive income
are as follows:
in millions 2006 2005
Accumulated other comprehensive income:
Currency translation adjustment $38 $ 44
Unrealized net hedging losses, net of taxes (6) (10)
Unrealized net loss on investment, net of taxes –(1)
Minimum pension liability adjustment, net of taxes (15) (5)
Total accumulated other comprehensive income $17 $ 28
The components of other comprehensive income (loss) are as follows:
in millions Before Tax Income Tax After Tax
Fiscal 2006:
Currency translation adjustment $(6) $ – $ (6)
Pension unrealized loss (16) 6 (10)
Investments unrealized gain 1 – 1
Net hedging gain 1 – 1
Net hedging loss reclassified to
income statement 6(3) 3
Other comprehensive loss – 2006 $(14) $ 3 $(11)
Fiscal 2005:
Currency translation adjustment $ 23 $ – $ 23
Pension unrealized loss (2) 1 (1)
Investments unrealized loss (3) 1 (2)
Net hedging loss (1) – (1)
Net hedging loss reclassified to
income statement 34 (13) 21
Other comprehensive income – 2005 $ 51 $ (11) $ 40
Fiscal 2004:
Currency translation adjustment $ 23 $ – $ 23
Pension unrealized gain 2 (1) 1
Net hedging gain 31 (12) 19
Net hedging gain reclassified to
income statement (66) 26 (40)
Other comprehensive income (loss) – 2004 $(10) $ 13 $ 3
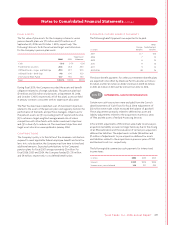
NOTE 11 STOCK-BASED COMPENSATION
In the first quarter of fiscal 2006, the Company adopted SFAS
No. 123R using the modified prospective method. Under the modi-
fied prospective method, compensation cost is recognized for all
share-based payments granted after the adoption of SFAS No. 123R
and for all awards granted to employees prior to the adoption
date of SFAS No. 123R that were unvested on the adoption date.
Accordingly, no restatements were made to prior periods.
Prior to the adoption of SFAS No. 123R, the Company applied
Accounting Principles Board Opinion No. 25, “Accounting for Stock
Issued to Employees” in accounting for its employee stock compen-
sation plans. Accordingly, no compensation expense was recog-
nized for its stock option issuances, as stock options are issued
with an exercise price equal to the closing price at the date of
grant. Also, prior to the adoption of SFAS No. 123R, the Company
issued restricted stock and recorded the fair value of such awards
as deferred compensation amortized over the vesting period. Had
compensation expense for the employee stock compensation plans
been determined based on the fair value method of accounting
for the Company’s stock compensation plans according to FASB
Statement No. 123, “Accounting for Stock-Based Compensation,”
the tax-effected impact would be as follows:
in millions, except per share data 2005 2004
Net income, as reported $ 372 $ 403
Stock-based employee compensation
expense included in net income, net of tax 15 10
Total stock-based employee compensation
expense determined under fair value based
method for all awards, net of tax (22) (16)
Pro forma net income $ 365 $ 397
Earnings per share
As reported
Class A Basic $1.11 $1.20
Class B Basic $1.00 $1.08
Diluted $1.04 $1.13
Pro forma
Class A Basic $1.09 $1.18
Class B Basic $0.98 $1.06
Diluted $1.02 $1.11
44 Ty s on Foods, Inc. 2006 Annual Report
Notes to Consolidated Financial Statements continued