Tyson Foods 2006 Annual Report Download - page 40
Download and view the complete annual report
Please find page 40 of the 2006 Tyson Foods annual report below. You can navigate through the pages in the report by either clicking on the pages listed below, or by using the keyword search tool below to find specific information within the annual report.-
 1
1 -
2
-
3
-
4
-
5
-
6
-
7
-
8
-
9
-
10
-
11
-
12
-
13
-
14
-
15
-
16
-
17
-
18
-
19
-
20
-
21
-
22
-
23
-
24
-
25
-
26
-
27
-
28
-
29
-
 30
30 -
 31
31 -
 32
32 -
 33
33 -
 34
34 -
 35
35 -
 36
36 -
 37
37 -
 38
38 -
 39
39 -
 40
40 -
 41
41 -
 42
42 -
 43
43 -
 44
44 -
 45
45 -
 46
46 -
 47
47 -
 48
48 -
 49
49 -
 50
50 -
51
-
52
-
53
-
54
-
55
-
56
-
57
-
58
-
59
-
60
-
61
-
62
-
63
-
64
-
65
-
66
-
67
-
68
 |
 |

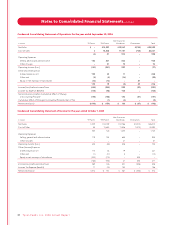
Condensed Consolidating Statement of Operations for the year ended September 30, 2006
Non-Guarantor
in millions TFI Parent TFM Parent Subsidiaries Eliminations Total
Net Sales $ – $14,227 $12,067 $(735) $25,559
Cost of Sales 3 14,206 11,157 (735) 24,631
(3) 21 910 – 928
Operating Expenses:
Selling, general and administrative 130 201 604 – 935
Other charges – 51 19 – 70
Operating Income (Loss) (133) (231) 287 – (77)
Other (Income) Expense:
Interest expense, net 192 35 11 – 238
Other, net (3) (3) (16) – (22)
Equity in net earnings of subsidiaries (14) (13) – 27 –
175 19 (5) 27 216
Income (Loss) before Income Taxes (308) (250) 292 (27) (293)
Income Tax Expense (Benefit) (112) (92) 102 – (102)
Net Income (Loss) before Cumulative Effect of Change
in Accounting Principle (196) (158) 190 (27) (191)
Cumulative Effect of Change in Accounting Principle, Net of Tax – (1) (4) – (5)
Net Income (Loss) $(196) $ (159) $ 186 $ (27) $ (196)
Condensed Consolidating Statement of Income for the year ended October 1, 2005
Non-Guarantor
in millions TFI Parent TFM Parent Subsidiaries Eliminations Total
Net Sales $ 429 $14,009 $12,786 $(1,210) $26,014
Cost of Sales 85 13,883 11,536 (1,210) 24,294
344 126 1,250 – 1,720
Operating Expenses:
Selling, general and administrative 119 154 655 – 928
Other charges – – 47 – 47
Operating Income (Loss) 225 (28) 548 – 745
Other (Income) Expense:
Interest expense, net 170 38 19 – 227
Other, net (1) (17) 8 – (10)
Equity in net earnings of subsidiaries (333) (175) – 508 –
(164) (154) 27 508 217
Income (Loss) before Income Taxes 389 126 521 (508) 528
Income Tax Expense (Benefit) 17 (15) 154 – 156
Net Income (Loss) $ 372 $ 141 $ 367 $ (508) $ 372
38 Ty s o n F o o d s , I n c . 2 0 0 6 A n n u a l R e p o r t
Notes to Consolidated Financial Statements continued