Tyson Foods 2006 Annual Report Download - page 16
Download and view the complete annual report
Please find page 16 of the 2006 Tyson Foods annual report below. You can navigate through the pages in the report by either clicking on the pages listed below, or by using the keyword search tool below to find specific information within the annual report.-
 1
1 -
2
-
3
-
4
-
5
-
 6
6 -
 7
7 -
 8
8 -
 9
9 -
 10
10 -
 11
11 -
 12
12 -
 13
13 -
 14
14 -
 15
15 -
 16
16 -
 17
17 -
 18
18 -
 19
19 -
 20
20 -
 21
21 -
 22
22 -
 23
23 -
 24
24 -
 25
25 -
 26
26 -
27
-
28
-
29
-
30
-
31
-
32
-
33
-
34
-
35
-
36
-
37
-
38
-
39
-
40
-
41
-
42
-
43
-
44
-
45
-
46
-
47
-
48
-
49
-
50
-
51
-
52
-
53
-
54
-
55
-
56
-
57
-
58
-
59
-
60
-
61
-
62
-
63
-
64
-
65
-
66
-
67
-
68
 |
 |

realized and unrealized gains of $127 million in fiscal 2004. The
fiscal 2004 gains in part were due to grain commodity risk manage-
ment activities not designated as SFAS No. 133 hedges. Also, lower
domestic cattle supplies and restrictions on imports of Canadian
cattle for most of fiscal 2005 caused lower production volumes
and higher operating cost per head.
• Selling, general and administrative expenses increased $48 mil-
lion or 5.5%. As a percent of sales, selling, general and administrative
expenses increased from 3.3% to 3.6%. The increase primarily was
due to an increase of approximately $28 million in corporate adver-
tising expenses, which primarily was related to the Company’s
“Powered by TysonTM” campaign. In addition, there were increases
in personnel-related costs and contributions and donations.
• Other charges include $33 million related to a legal settlement
involving the Company’s live swine operations and $14 million in
plant closing costs, primarily related to the closings of the Company’s
Cleveland Street Forest, Mississippi; Portland, Maine; and Bentonville,
Arkansas; operations. In July 2005, the Company announced it had
agreed to settle a lawsuit resulting from the restructuring of its live
swine operations. The settlement resulted in the Company record-
ing an additional $33 million of costs in the third quarter of fiscal
2005. In July 2005, the Company announced its decision to make
improvements to one of its Forest, Mississippi, facilities, which
included more product lines, enabling the plant to increase pro-
duction of processed and marinated chicken. The improvements
were made at the former Choctaw Maid Farms location, which the
Company acquired in fiscal 2003. The Company’s Cleveland Street
Forest, Mississippi, poultry operation ceased operations in March
2006. Also in July 2005, the Company announced its decision to
close its Bentonville, Arkansas, facility. The production from this
facility was transferred to the Company’s Russellville, Arkansas,
poultry plant, where an expansion enabled the facility to absorb
the Bentonville facility’s production. In December 2004, the
Company announced its decision to close its Portland, Maine,
facility. The plant ceased operations February 4, 2005, and the
production from this facility was transferred to other locations.
Other charges in fiscal 2004 include $40 million in plant closing
costs, primarily related to the closings of the Company’s Jackson,
Mississippi; Manchester, New Hampshire; Augusta, Maine; and
Berlin, Maryland; operations. Also included in other charges for
fiscal 2004 were $25 million in charges related to intangible asset
impairments and $21 million related to fixed asset write-downs.
• Interest expense decreased $43 million or 15.4%, primarily result-
ing from an 8.7% decrease in the Company’s average indebtedness.
In addition, the Company incurred $13 million of expenses in fiscal
2004, related to the buy back of bonds and the early redemption
of Tyson de Mexico preferred shares. Excluding these charges, the
overall weighted average borrowing rate decreased from 7.4% to 7.1%.
• Other expense decreased $17 million compared to fiscal
2004, resulting from improvements in foreign currency exchange
gain/loss activity of approximately $9 million, primarily from the
Company’s Canadian operations, and an $8 million gain recorded
in fiscal 2005 from the sale of the Company’s remaining interest
in Specialty Brands, Inc.
• The effective tax rate decreased from 36.6% in fiscal 2004 to 29.5%
in fiscal 2005. The fiscal 2005 effective rate reflects a reduction of
4.1% due to the release of income tax reserves management deemed
were no longer required. The fiscal 2005 effective rate also reflects
a reduction of 3.6% due to the federal income tax effect of the
Medicare Part D subsidy in fiscal 2005 because this amount is not
subject to federal income tax. In addition, the rate reflects an
increase of 4.2% relating to the repatriation of earnings of foreign
subsidiaries as allowed by the American Jobs Creation Act, offset
by 2.9% relating to the reversal of certain international tax reserves
no longer needed due to the effects of the repatriation under the
American Jobs Creation Act. During the fourth quarter of fiscal
2005, the Company repatriated $404 million of foreign earnings
invested outside the United States under the American Jobs
Creation Act. See Note 15 in the Notes to Consolidated Financial
Statements for further discussion of these issues. The estimated
Extraterritorial Income Exclusion (ETI) amount reduced the fiscal
2005 effective tax rate by 2.6% compared to 0.5% in fiscal 2004.
The increase in the fiscal 2005 estimated ETI benefit resulted from
an increase in the estimated fiscal 2005 profit from export sales
primarily due to increased profit on export sales, along with an
adjustment to the estimated fiscal 2004 benefit.
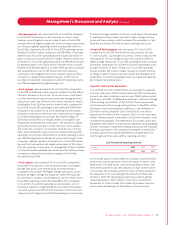
Sales by Segment
Average
Volume Price
in millions 2005 2004 Change Change Change
Chicken $ 8,295 $ 8,363 $ (68) (2.6)% 1.8%
Beef 11,618 11,951 (333) (0.0)% (2.8)%
Pork 3,247 3,185 62 (4.6)% 6.9%
Prepared Foods 2,801 2,891 (90) (6.7)% 3.8%
Other 53 51 2 N/A N/A
Total $26,014 $26,441 $(427) (2.3)% 0.7%
Operating Income (Loss) by Segment
Margin Margin
in millions 2005 2004 Change 2005 2004
Chicken $582 $548 $ 34 7.0% 6.6%
Beef (12) 127 (139) (0.1)% 1.1%
Pork 47 140 (93) 1.4% 4.4%
Prepared Foods 78 28 50 2.8% 1.0%
Other 50 74 (24) N/A N/A
Total $745 $917 $(172) 2.9% 3.5%
14 Ty s o n F o o d s , I n c . 2 0 0 6 A n n u a l R e p o r t
Management’s Discussion and Analysis continued