Tyson Foods 2006 Annual Report Download - page 50
Download and view the complete annual report
Please find page 50 of the 2006 Tyson Foods annual report below. You can navigate through the pages in the report by either clicking on the pages listed below, or by using the keyword search tool below to find specific information within the annual report.-
 1
1 -
2
-
3
-
4
-
5
-
6
-
7
-
8
-
9
-
10
-
11
-
12
-
13
-
14
-
15
-
16
-
17
-
18
-
19
-
20
-
21
-
22
-
23
-
24
-
25
-
26
-
27
-
28
-
29
-
30
-
31
-
32
-
33
-
34
-
35
-
36
-
37
-
38
-
39
-
 40
40 -
 41
41 -
 42
42 -
 43
43 -
 44
44 -
 45
45 -
 46
46 -
 47
47 -
 48
48 -
 49
49 -
 50
50 -
 51
51 -
 52
52 -
 53
53 -
 54
54 -
 55
55 -
 56
56 -
 57
57 -
 58
58 -
 59
59 -
 60
60 -
61
-
62
-
63
-
64
-
65
-
66
-
67
-
68
 |
 |

To determine the rate-of-return on assets assumption, the Company
first examined historical rates of return for the various asset classes.
The Company then determined a long-term projected rate-of-return
based on expected returns over the next five to 10 years. Prior to
fiscal 2004, the Company only had defined benefit plans that pro-
vided a retirement benefit based on the number of years of service
multiplied by a benefit rate. During 2004, a plan was added with a 4%
compensation increase inherent in its benefit obligation calculation.
The Company has four postretirement health plans. Two of these
consist of fixed, annual payments by the Company and account for
$38 million of the Company’s postretirement medical obligation at
September 30, 2006. A healthcare cost trend is not required to
determine this obligation. The remaining two plans, Pre-Medicare
and Post-Medicare, account for $23 million of the Company’s
postretirement medical obligation at year end. The Pre-Medicare
plan covers retirees who do not yet qualify for Medicare and uses
a healthcare cost trend of 11% in the current year, grading down to
6% in fiscal 2012. The Post-Medicare plan provides secondary cover-
age to retirees covered under Medicare and has a healthcare cost
trend of 8%, grading down to 5% in fiscal 2010. Claims in excess of
the Company’s negotiated annual maximum payment are paid by
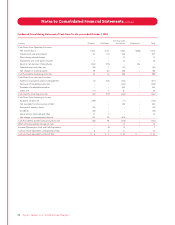
the plan participants. Assumed healthcare cost trend rates would
have the following effects:
One-Percentage- One-Percentage-
in millions Point Increase Point Decrease
Effect on total of service and interest cost $ 1 $ (1)
Effect on postretirement benefit obligation 26 (21)
48 Ty s on Foods, Inc. 2006 Annual Report
Notes to Consolidated Financial Statements continued
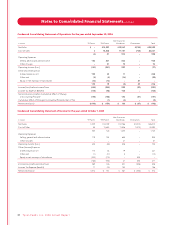
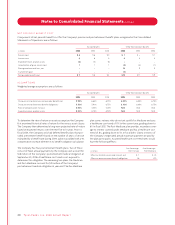
NET PERIODIC BENEFIT CO S T
Components of net periodic benefit cost for the Company’s pension and postretirement benefit plans recognized in the Consolidated
Statements of Operations are as follows:
Pension Benefits Other Postretirement Benefits
in millions 2006 2005 2004 2006 2005 2004
Service cost $ 6 $ 6 $ 3 $ 1 $ – $ 1
Interest cost 66 5 44 4
Expected return on plan assets (6) (5) (5) –– –
Amortization of prior service cost 11 1 (2) (2) (1)
Recognized actuarial loss, net –– – 14 9 5
Curtailment gain –– – (2) – –
Net periodic benefit cost $ 7 $ 8 $ 4 $15 $11 $ 9
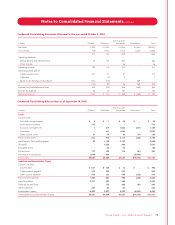
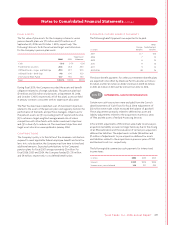
ASSUMPTIONS
Weighted average assumptions are as follows:
Pension Benefits Other Postretirement Benefits
2006 2005 2004 2006 2005 2004
Discount rate to determine net periodic benefit cost 5.94% 6.62% 6.75% 6.00% 6.00% 6.75%
Discount rate to determine benefit obligations 5.80% 5.91% 6.75% 6.10% 6.00% 6.75%
Rate of compensation increase 4.00% 4.00% 4.00% N/A N/A N/A
Expected return on plan assets 8.03% 8.13% 8.50% N/A N/A N/A