Tyson Foods 2006 Annual Report Download - page 17
Download and view the complete annual report
Please find page 17 of the 2006 Tyson Foods annual report below. You can navigate through the pages in the report by either clicking on the pages listed below, or by using the keyword search tool below to find specific information within the annual report.-
 1
1 -
2
-
3
-
4
-
5
-
6
-
 7
7 -
 8
8 -
 9
9 -
 10
10 -
 11
11 -
 12
12 -
 13
13 -
 14
14 -
 15
15 -
 16
16 -
 17
17 -
 18
18 -
 19
19 -
 20
20 -
 21
21 -
 22
22 -
 23
23 -
 24
24 -
 25
25 -
 26
26 -
 27
27 -
28
-
29
-
30
-
31
-
32
-
33
-
34
-
35
-
36
-
37
-
38
-
39
-
40
-
41
-
42
-
43
-
44
-
45
-
46
-
47
-
48
-
49
-
50
-
51
-
52
-
53
-
54
-
55
-
56
-
57
-
58
-
59
-
60
-
61
-
62
-
63
-
64
-
65
-
66
-
67
-
68
 |
 |

• Chicken segment sales decreased 0.8% in fiscal 2005 compared
to fiscal 2004. The decline in sales primarily was due to lower
volumes, caused largely by one less week of sales in fiscal 2005,
partially offset by higher average sales prices and improved product
mix. Chicken segment operating income increased $34 million in
fiscal 2005 compared to fiscal 2004. Fiscal 2005 operating income
includes $12 million of plant closing costs and $8 million of hurricane-
related losses. Fiscal 2004 operating income includes $13 million of
plant closing costs and $13 million of charges related to fixed asset
write-downs. Fiscal 2005 operating income was affected positively
by decreased grain costs of $312 million. However, the fiscal 2005
benefits from decreased grain costs were offset partially by realized
and unrealized net losses of $27 million from the Company’s
commodity risk management activities related to grain purchases,
compared to realized and unrealized net gains of $127 million
recorded in fiscal 2004. Additionally, fiscal 2005 operating income
was affected negatively by higher energy costs.
• Beef segment sales decreased 2.8% in fiscal 2005 compared to
fiscal 2004. The decline in sales primarily resulted from the effects
of import and export restrictions. Those restrictions contributed
to lower international sales volumes and lower average domestic
sales prices in part due to the mix of products allowed for export.
Additionally, fiscal 2005 had one less week of sales, compared to
fiscal 2004. Fiscal 2005 operating income decreased $139 million
compared to fiscal 2004. Fiscal 2005 operating income includes
$10 million received in connection with vitamin antitrust litigation.
Fiscal 2004 operating income includes BSE-related charges of
$61 million and $5 million of charges related to intangible asset
impairments and fixed asset write-downs. The decrease in operat-
ing income primarily was due to lower domestic cattle supplies
and restrictions on imports of Canadian cattle for most of fiscal
2005, which resulted in lower production volumes and raised the
operating cost per head. Additionally, fiscal 2005 operating income
was affected negatively by decreased volumes and margins at the
Company’s Lakeside operation in Canada. Also, fiscal 2005 operat-
ing results include realized and unrealized net gains of $13 million
from the Company’s commodity risk management activities related
to its fixed forward boxed beef sales and forward live cattle purchases,
compared to realized and unrealized net gains of $51 million
recorded in fiscal 2004.
• Pork segment sales increased 1.9% in fiscal 2005 compared to
fiscal 2004. The increase in sales resulted primarily from higher
average sales prices, both domestically and internationally,
compared to fiscal 2004. The higher average sales prices, driven
primarily by higher average live hog prices, were offset partially
by a decrease in volumes, caused largely by one less week of sales.
Fiscal 2005 operating income decreased $93 million compared
to fiscal 2004. Fiscal 2005 operating income includes costs of
$33 million related to a legal settlement involving the Company’s
live swine operations and $2 million received in connection with
vitamin antitrust litigation. Fiscal 2004 operating income includes
$1 million of charges related to fixed asset write-downs. The decrease
in operating income primarily was due to higher average live hog
prices and lower volumes, which increased the operating cost per
head and more than offset the increase in average sales prices.
• Prepared Foods segment sales decreased 3.1% in fiscal 2005
compared to fiscal 2004. The decline in sales primarily was due
to lower volumes, caused largely by one less week of sales and the
rationalization of lower margin product lines, partially offset by
higher average sales prices. Fiscal 2005 operating income increased
$50 million compared to fiscal 2004. Fiscal 2005 operating income
includes $2 million of plant closing costs. Fiscal 2004 operating
income includes $27 million of plant closing costs and $27 million
of charges related to fixed asset write-downs and intangible asset
impairments. Fiscal 2005 operating income was negatively impacted
by increased raw material prices.
LIQUIDITY AND CAPITAL RESOURCES
In fiscal 2006, net cash of $287 million was provided by operating
activities, a decrease of $712 million from fiscal 2005. The decrease
primarily was due to a decline in net income of $605 million, exclud-
ing the non-cash effect of deferred income taxes, and the net change
in the working capital effect of $147 million. The Company used
cash primarily from borrowings and operations to fund $531 million
of property, plant and equipment additions, to pay dividends of
$55 million on the Company’s Class A and Class B stock and to
repurchase $42 million of the Company’s Class A stock in the open
market, which purchases were made to satisfy the Company’s stock
compensation programs. The expenditures for property, plant and
equipment were related to acquiring new equipment and upgrading
facilities to maintain competitive standing and position the Company
for future opportunities. The Company’s foreseeable cash needs for
operations growth and capital expenditures are expected to be
met through cash flows provided by operating activities.
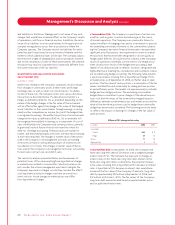
Cash Provided by Operating Activities
in millions 2006 2005 2004
$287 $999 $932
In the second quarter of fiscal 2006, the Company issued $1.0 billion
of new senior unsecured notes, which will mature on April 1, 2016
(2016 Notes). The 2016 Notes carried an initial 6.60% interest rate,
with interest payments due semi-annually on April 1 and October 1.
In fiscal 2007, the Company used $750 million of the proceeds for
the repayment of its outstanding $750 million 7.25% Notes due
October 1, 2006. The remaining proceeds were used for general
corporate purposes. The Company’s short-term investment at
September 30, 2006, includes $750 million of proceeds from this
new issuance and earnings of $20 million on the investment.
Ty s o n F o o d s , I n c . 2 0 0 6 A n n u a l R e p o r t 15
Management’s Discussion and Analysis continued