Tyson Foods 2006 Annual Report Download - page 26
Download and view the complete annual report
Please find page 26 of the 2006 Tyson Foods annual report below. You can navigate through the pages in the report by either clicking on the pages listed below, or by using the keyword search tool below to find specific information within the annual report.-
 1
1 -
2
-
3
-
4
-
5
-
6
-
7
-
8
-
9
-
10
-
11
-
12
-
13
-
14
-
15
-
 16
16 -
 17
17 -
 18
18 -
 19
19 -
 20
20 -
 21
21 -
 22
22 -
 23
23 -
 24
24 -
 25
25 -
 26
26 -
 27
27 -
 28
28 -
 29
29 -
 30
30 -
 31
31 -
 32
32 -
 33
33 -
 34
34 -
 35
35 -
 36
36 -
37
-
38
-
39
-
40
-
41
-
42
-
43
-
44
-
45
-
46
-
47
-
48
-
49
-
50
-
51
-
52
-
53
-
54
-
55
-
56
-
57
-
58
-
59
-
60
-
61
-
62
-
63
-
64
-
65
-
66
-
67
-
68
 |
 |

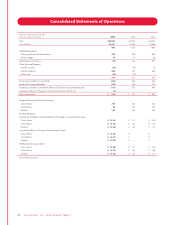
Three years ended September 30, 2006 September 30, 2006 October 1, 2005 October 2, 2004
in millions Shares Amount Shares Amount Shares Amount
Class A Common Stock:
Balance at beginning of year 268 $27 268 $ 27 267 $ 27
Conversion from Class B shares 16 1– – – –
Reclassification and other – – – – 1 –
Balance at end of year 284 28 268 27 268 27
Class B Common Stock:
Balance at beginning of year 102 10 102 10 102 10
Conversion to Class A shares (16) (1) – – – –
Balance at end of year 86 9102 10 102 10
Capital in Excess of Par Value:
Balance at beginning of year 1,867 1,849 1,861
Stock options exercised (2) 14 (2)
Restricted shares issued (16) – 1
Restricted shares canceled 31 1
Cumulative effect of adoption of SFAS No. 123R (55) – –
Restricted share amortization 26 – –
Reclassification and other 12 3(12)
Balance at end of year 1,835 1,867 1,849
Retained Earnings:
Balance at beginning of year 3,032 2,728 2,380
Net income (loss) (196) 372 403
Dividends paid (55) (55) (55)
Dividends accrued –(13) –
Balance at end of year 2,781 3,032 2,728
Accumulated Other Comprehensive Income (Loss), Net of Tax:
Balance at beginning of year 28 (12) (15)
Net hedging (gain) loss recognized in cost of sales 321 (40)
Net hedging unrealized gain (loss) 1(1) 19
Unrealized gain (loss) on investments 1(2) –
Currency translation adjustment (6) 23 23
Additional pension liability (10) (1) 1
Balance at end of year 17 28 (12)
Treasury Stock:
Balance at beginning of year 15 (238) 17 (264) 16 (252)
Purchase of treasury shares 3 (42) 3(45) 4(72)
Stock options exercised (2) 35 (3) 37 (3) 44
Restricted shares issued (1) 20 (2) 38 – 6
Restricted shares canceled –(5) – (4) – (4)
Reclassification and other – – – – – 14
Balance at end of year 15 (230) 15 (238) 17 (264)
Unamortized Deferred Compensation:
Balance at beginning of year (55) (46) (57)
Restricted shares issued –(35) (7)
Restricted shares canceled –1 2
Amortization of deferred compensation –25 16
Cumulative effect of adoption of SFAS No. 123R 55 – –
Balance at end of year –(55) (46)
Total Shareholders’ Equity$4,440 $4,671 $4,292
Comprehensive Income (Loss):
Net income (loss) $(196) $ 372 $403
Other comprehensive income (loss), net of tax (11) 40 3
Total Comprehensive Income (Loss) $(207) $ 412 $ 406
See accompanying notes.
24 Ty s on Foods, Inc. 2006 Annual Report
Consolidated Statements of Shareholders’ Equity