Toyota 2009 Annual Report Download - page 99
Download and view the complete annual report
Please find page 99 of the 2009 Toyota annual report below. You can navigate through the pages in the report by either clicking on the pages listed below, or by using the keyword search tool below to find specific information within the annual report.-
 1
1 -
2
-
3
-
4
-
5
-
6
-
7
-
8
-
9
-
10
-
11
-
12
-
13
-
14
-
15
-
16
-
17
-
18
-
19
-
20
-
21
-
22
-
23
-
24
-
25
-
26
-
27
-
28
-
29
-
30
-
31
-
32
-
33
-
34
-
35
-
36
-
37
-
38
-
39
-
40
-
41
-
42
-
43
-
44
-
45
-
46
-
47
-
48
-
49
-
50
-
51
-
52
-
53
-
54
-
55
-
56
-
57
-
58
-
59
-
60
-
61
-
62
-
63
-
64
-
65
-
66
-
67
-
68
-
69
-
70
-
71
-
72
-
73
-
74
-
75
-
76
-
77
-
78
-
79
-
80
-
81
-
82
-
83
-
84
-
85
-
86
-
87
-
88
-
 89
89 -
 90
90 -
 91
91 -
 92
92 -
 93
93 -
 94
94 -
 95
95 -
 96
96 -
 97
97 -
 98
98 -
 99
99 -
 100
100 -
 101
101 -
 102
102 -
 103
103 -
 104
104 -
 105
105 -
 106
106 -
 107
107 -
 108
108 -
 109
109 -
110
-
111
-
112
 |
 |

The Right Way Forward Business OverviewPerformance Overview Financial Section
Investor
Information
Management &
Corporate Information
Top Messages
Annual Report 2009 97
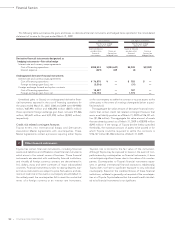
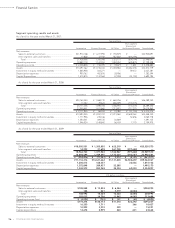
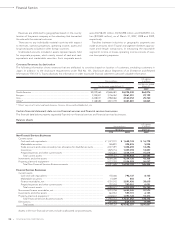
Geographic Information
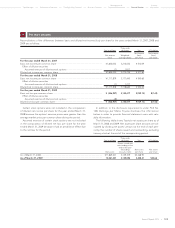
As of and for the year ended March 31, 2007:
Yen in millions
Inter-segment
Elimination/
Japan North America Europe Asia Other Unallocated Amount Consolidated
Net revenues
Sales to external customers ......... ¥ 8,152,884 ¥ 8,771,495 ¥3,346,013 ¥1,969,957 ¥1,707,742 ¥ — ¥23,948,091
Inter-segment sales
and transfers ................................ 6,662,398 258,278 196,180 255,571 215,000 (7,587,427) —
Total ............................................ 14,815,282 9,029,773 3,542,193 2,225,528 1,922,742 (7,587,427) 23,948,091
Operating expenses ..................... 13,358,036 8,580,140 3,404,810 2,107,933 1,839,245 (7,580,756) 21,709,408
Operating income ........................ ¥ 1,457,246 ¥ 449,633 ¥ 137,383 ¥ 117,595 ¥ 83,497 ¥ (6,671) ¥ 2,238,683
Assets ............................................. ¥12,992,379 ¥10,890,157 ¥2,917,183 ¥1,563,742 ¥1,575,255 ¥ 2,636,063 ¥32,574,779
Long-lived assets .......................... 3,490,846 2,931,037 566,353 466,338 309,465 — 7,764,039
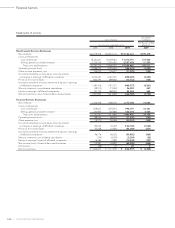
As of and for the year ended March 31, 2008:
Yen in millions
Inter-segment
Elimination/
Japan North America Europe Asia Other Unallocated Amount Consolidated
Net revenues
Sales to external customers ......... ¥ 8,418,620 ¥ 9,248,950 ¥3,802,814 ¥2,790,987 ¥2,027,869 ¥ — ¥26,289,240
Inter-segment sales
and transfers ................................ 6,897,192 174,308 190,620 329,839 266,268 (7,858,227) —
Total ............................................ 15,315,812 9,423,258 3,993,434 3,120,826 2,294,137 (7,858,227) 26,289,240
Operating expenses ..................... 13,875,526 9,117,906 3,851,863 2,864,470 2,150,159 (7,841,059) 24,018,865
Operating income ........................ ¥ 1,440,286 ¥ 305,352 ¥ 141,571 ¥ 256,356 ¥ 143,978 ¥ (17,168) ¥ 2,270,375
Assets ............................................. ¥12,883,255 ¥10,779,947 ¥3,125,572 ¥1,792,681 ¥1,703,533 ¥ 2,173,332 ¥32,458,320
Long-lived assets .......................... 3,696,081 2,808,782 574,854 446,513 285,772 — 7,812,002
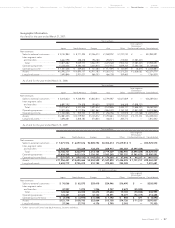
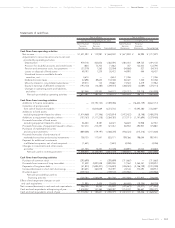
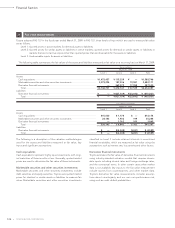
As of and for the year ended March 31, 2009:
Yen in millions
Inter-segment
Elimination/
Japan North America Europe Asia Other Unallocated Amount Consolidated
Net revenues
Sales to external customers ......... ¥ 7,471,916 ¥ 6,097,676 ¥2,889,753 ¥2,450,412 ¥1,619,813 ¥ — ¥20,529,570
Inter-segment sales
and transfers ................................ 4,714,821 125,238 123,375 268,917 263,087 (5,495,438) —
Total ............................................ 12,186,737 6,222,914 3,013,128 2,719,329 1,882,900 (5,495,438) 20,529,570
Operating expenses ..................... 12,424,268 6,613,106 3,156,361 2,543,269 1,795,252 (5,541,675) 20,990,581
Operating income (loss) ............... ¥ (237,531) ¥ (390,192) ¥ (143,233) ¥ 176,060 ¥ 87,648 ¥ 46,237 ¥ (461,011)
Assets ............................................. ¥11,956,431 ¥10,685,466 ¥2,324,528 ¥1,547,890 ¥1,446,505 ¥ 1,101,217 ¥29,062,037
Long-lived assets .......................... 3,658,719 2,726,419 410,185 372,330 234,028 — 7,401,681
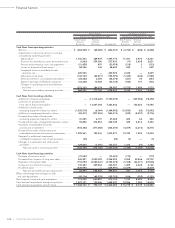
U.S. dollars in millions
Inter-segment
Elimination/
Japan North America Europe Asia Other Unallocated Amount Consolidated
Net revenues
Sales to external customers ......... $ 76,066 $ 62,075 $29,418 $24,946 $16,490 $ — $208,995
Inter-segment sales
and transfers ................................ 47,997 1,275 1,256 2,737 2,679 (55,944) —
Total ............................................ 124,063 63,350 30,674 27,683 19,169 (55,944) 208,995
Operating expenses ..................... 126,481 67,322 32,132 25,891 18,277 (56,415) 213,688
Operating income (loss) ............... $ (2,418) $ (3,972) $ (1,458) $ 1,792 $ 892 $ 471 $ (4,693)
Assets ............................................. $121,719 $108,780 $23,664 $15,758 $14,726 $ 11,210 $295,857
Long-lived assets .......................... 37,246 27,755 4,176 3,790 2,383 — 75,350
* “Other” consists of Central and South America, Oceania and Africa.