Toyota 2009 Annual Report Download - page 100
Download and view the complete annual report
Please find page 100 of the 2009 Toyota annual report below. You can navigate through the pages in the report by either clicking on the pages listed below, or by using the keyword search tool below to find specific information within the annual report.-
 1
1 -
2
-
3
-
4
-
5
-
6
-
7
-
8
-
9
-
10
-
11
-
12
-
13
-
14
-
15
-
16
-
17
-
18
-
19
-
20
-
21
-
22
-
23
-
24
-
25
-
26
-
27
-
28
-
29
-
30
-
31
-
32
-
33
-
34
-
35
-
36
-
37
-
38
-
39
-
40
-
41
-
42
-
43
-
44
-
45
-
46
-
47
-
48
-
49
-
50
-
51
-
52
-
53
-
54
-
55
-
56
-
57
-
58
-
59
-
60
-
61
-
62
-
63
-
64
-
65
-
66
-
67
-
68
-
69
-
70
-
71
-
72
-
73
-
74
-
75
-
76
-
77
-
78
-
79
-
80
-
81
-
82
-
83
-
84
-
85
-
86
-
87
-
88
-
89
-
 90
90 -
 91
91 -
 92
92 -
 93
93 -
 94
94 -
 95
95 -
 96
96 -
 97
97 -
 98
98 -
 99
99 -
 100
100 -
 101
101 -
 102
102 -
 103
103 -
 104
104 -
 105
105 -
 106
106 -
 107
107 -
 108
108 -
 109
109 -
 110
110 -
111
-
112
 |
 |

Financial Section
TOYOTA MOTOR CORPORATION
98
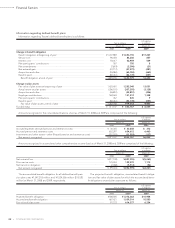
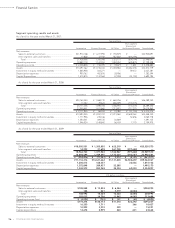
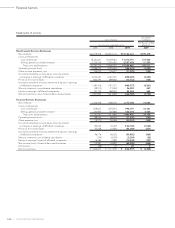
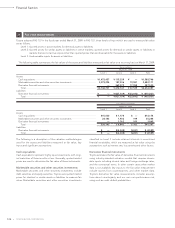
Balance sheets
U.S. dollars
Yen in millions in millions
March 31, March 31,
2008 2009 2009
Non-Financial Services Businesses
Current assets
Cash and cash equivalents .................................................................................................. ¥ 1,473,101 ¥ 1,648,143 $ 16,778
Marketable securities........................................................................................................... 526,801 494,476 5,034
Trade accounts and notes receivable, less allowance for doubtful accounts ................. 2,077,491 1,404,292 14,296
Inventories ............................................................................................................................ 1,825,716 1,459,394 14,857
Prepaid expenses and other current assets ....................................................................... 1,676,263 1,534,119 15,618
Total current assets .......................................................................................................... 7,579,372 6,540,424 66,583
Investments and other assets ................................................................................................. 6,064,286 4,254,126 43,308
Property, plant and equipment ............................................................................................... 5,773,370 5,504,559 56,037
Total Non-Financial Services Businesses assets ............................................................ 19,417,028 16,299,109 165,928
Financial Services Businesses
Current assets
Cash and cash equivalents .................................................................................................. 155,446 796,137 8,105
Marketable securities........................................................................................................... 15,409 850 9
Finance receivables, net ...................................................................................................... 4,301,142 3,891,406 39,615
Prepaid expenses and other current assets ....................................................................... 793,434 790,901 8,051
Total current assets .......................................................................................................... 5,265,431 5,479,294 55,780
Noncurrent finance receivables, net ...................................................................................... 5,974,756 5,655,545 57,575
Investments and other assets ................................................................................................. 663,553 599,701 6,105
Property, plant and equipment ............................................................................................... 2,038,632 1,897,122 19,313
Total Financial Services Businesses assets ..................................................................... 13,942,372 13,631,662 138,773
Eliminations .............................................................................................................................. (901,080) (868,734) (8,844)
Total assets ....................................................................................................................... ¥32,458,320 ¥29,062,037 $295,857
Assets in the non-financial services include unallocated corporate assets.
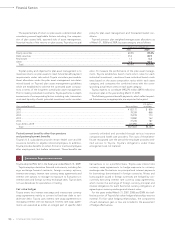
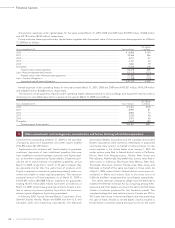
Revenues are attributed to geographies based on the country
location of the parent company or the subsidiary that transacted
the sale with the external customer.
There are no any individually material countries with respect
to revenues, operating expenses, operating income, assets and
long-lived assets included in other foreign countries.
Unallocated amounts included in assets represent assets held
for corporate purposes, which mainly consist of cash and cash
equivalents and marketable securities. Such corporate assets
were ¥4,758,410 million, ¥4,352,498 million and ¥3,225,901 mil-
lion ($32,840 million), as of March 31, 2007, 2008 and 2009,
respectively.
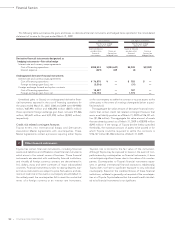
Transfers between industries or geographic segments are
made at amounts which Toyota’s management believes approxi-
mate arm’s-length transactions. In measuring the reportable
segments’ income or losses, operating income consists of reve-
nue less operating expenses.
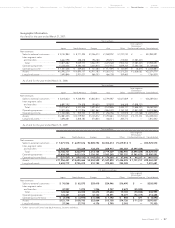
U.S. dollars
Yen in millions in millions
For the year ended
For the years ended March 31, March 31,
2007 2008 2009 2009
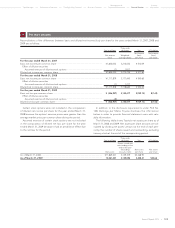
North America .................................................................................................... ¥9,039,560 ¥9,606,481 ¥6,294,230 $64,076
Europe ................................................................................................................. 3,345,001 3,746,362 2,861,351 29,129
Asia ...................................................................................................................... 2,248,031 2,968,460 2,530,352 25,760
Other* .................................................................................................................. 3,168,580 3,831,739 3,421,881 34,835
* “Other” consists of Central and South America, Oceania, Africa and the Middle East, etc.
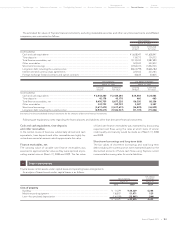
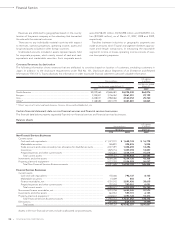
Certain fi nancial statement data on non-fi nancial services and fi nancial services businesses
The financial data below presents separately Toyota’s non-financial services and financial services businesses.
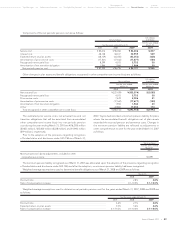
Overseas Revenues by destination
The following information shows revenues that are attributed to countries based on location of customers, excluding customers in
Japan. In addition to the disclosure requirements under FAS No. 131, Disclosure about Segments of an Enterprise and Related
Information (“FAS 131”), Toyota discloses this information in order to provide financial statement users with valuable information.