Toyota 2009 Annual Report Download - page 79
Download and view the complete annual report
Please find page 79 of the 2009 Toyota annual report below. You can navigate through the pages in the report by either clicking on the pages listed below, or by using the keyword search tool below to find specific information within the annual report.-
 1
1 -
2
-
3
-
4
-
5
-
6
-
7
-
8
-
9
-
10
-
11
-
12
-
13
-
14
-
15
-
16
-
17
-
18
-
19
-
20
-
21
-
22
-
23
-
24
-
25
-
26
-
27
-
28
-
29
-
30
-
31
-
32
-
33
-
34
-
35
-
36
-
37
-
38
-
39
-
40
-
41
-
42
-
43
-
44
-
45
-
46
-
47
-
48
-
49
-
50
-
51
-
52
-
53
-
54
-
55
-
56
-
57
-
58
-
59
-
60
-
61
-
62
-
63
-
64
-
65
-
66
-
67
-
68
-
 69
69 -
 70
70 -
 71
71 -
 72
72 -
 73
73 -
 74
74 -
 75
75 -
 76
76 -
 77
77 -
 78
78 -
 79
79 -
 80
80 -
 81
81 -
 82
82 -
 83
83 -
 84
84 -
 85
85 -
 86
86 -
 87
87 -
 88
88 -
 89
89 -
90
-
91
-
92
-
93
-
94
-
95
-
96
-
97
-
98
-
99
-
100
-
101
-
102
-
103
-
104
-
105
-
106
-
107
-
108
-
109
-
110
-
111
-
112
 |
 |
The Right Way Forward Business OverviewPerformance Overview Financial Section
Investor
Information
Management &
Corporate Information
Top Messages
Annual Report 2009 77
These hypothetical scenarios do not reflect expected market
conditions and should not be used as a prediction of future per-
formance. As the figures indicate, changes in the fair value may
not be linear. Also, in this table, the effect of a variation in a par-
ticular assumption on the fair value of the retained interest is
calculated without changing any other assumption. Actual
changes in one factor may result in changes in another, which
might magnify or counteract the sensitivities. Actual cash flows
may differ from the above analysis.
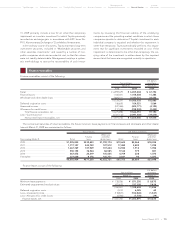
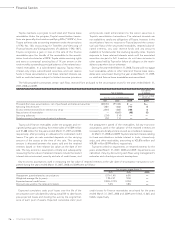
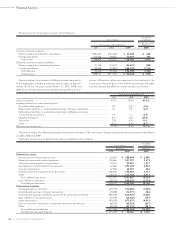
The key economic assumptions and the sensitivity of the current fair value of the retained interest to an immediate 10 and 20 percent
adverse change in those economic assumptions are presented below.
U.S. dollars
Yen in millions in millions
March 31, March 31,
2009 2009
Prepayment speed assumption (annual rate) ..................................................................................................... 0.5%–6.0%
Impact on fair value of 10% adverse change .................................................................................................. ¥ (232) $ (2)
Impact on fair value of 20% adverse change .................................................................................................. (419) (4)
Residual cash flows discount rate (annual rate).................................................................................................. 3.0%–6.5%
Impact on fair value of 10% adverse change .................................................................................................. ¥ (600) $ (6)
Impact on fair value of 20% adverse change .................................................................................................. (1,165) (12)
Expected credit losses (annual rate) ................................................................................................................... 0.05%–0.18%
Impact on fair value of 10% adverse change .................................................................................................. ¥ (8) $ (0)
Impact on fair value of 20% adverse change .................................................................................................. (16) (0)
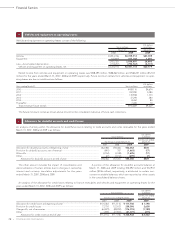
Outstanding receivable balances and delinquency amounts for managed retail and lease receivables, which include both owned and
securitized receivables, as of March 31, 2008 and 2009 are as follows:
U.S. dollars
Yen in millions in millions
March 31, March 31,
2008 2009 2009
Principal amount outstanding .......................................................................................................... ¥7,867,964 ¥7,481,016 $76,158
Delinquent amounts over 60 days or more ..................................................................................... 79,313 83,613 851
Comprised of:
Receivables owned ........................................................................................................................ ¥7,682,515 ¥7,358,641 $74,912
Receivables securitized ................................................................................................................. 185,449 122,375 1,246
Credit losses, net of recoveries attributed to managed retail and lease receivables for the years ended March 31, 2007, 2008 and 2009
totaled ¥63,428 million, ¥93,036 million and ¥124,939 million ($1,272 million), respectively.
Other receivables relate to arrangements with certain component manufacturers whereby Toyota procures inventory for these compo-
nent manufactures and is reimbursed for the related purchases.
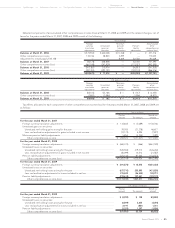
Inventories consist of the following:
U.S. dollars
Yen in millions in millions
March 31, March 31,
2008 2009 2009
Finished goods .................................................................................................................................. ¥1,211,569 ¥ 875,930 $ 8,917
Raw materials ..................................................................................................................................... 299,606 257,899 2,626
Work in process ................................................................................................................................. 239,937 251,670 2,562
Supplies and other ............................................................................................................................ 74,604 73,895 752
¥1,825,716 ¥1,459,394 $14,857
Other receivables:
8
Inventories:
9