Toyota 2009 Annual Report Download - page 10
Download and view the complete annual report
Please find page 10 of the 2009 Toyota annual report below. You can navigate through the pages in the report by either clicking on the pages listed below, or by using the keyword search tool below to find specific information within the annual report.-
 1
1 -
 2
2 -
 3
3 -
 4
4 -
 5
5 -
 6
6 -
 7
7 -
 8
8 -
 9
9 -
 10
10 -
 11
11 -
 12
12 -
 13
13 -
 14
14 -
 15
15 -
 16
16 -
 17
17 -
 18
18 -
 19
19 -
 20
20 -
 21
21 -
22
-
23
-
24
-
25
-
26
-
27
-
28
-
29
-
30
-
31
-
32
-
33
-
34
-
35
-
36
-
37
-
38
-
39
-
40
-
41
-
42
-
43
-
44
-
45
-
46
-
47
-
48
-
49
-
50
-
51
-
52
-
53
-
54
-
55
-
56
-
57
-
58
-
59
-
60
-
61
-
62
-
63
-
64
-
65
-
66
-
67
-
68
-
69
-
70
-
71
-
72
-
73
-
74
-
75
-
76
-
77
-
78
-
79
-
80
-
81
-
82
-
83
-
84
-
85
-
86
-
87
-
88
-
89
-
90
-
91
-
92
-
93
-
94
-
95
-
96
-
97
-
98
-
99
-
100
-
101
-
102
-
103
-
104
-
105
-
106
-
107
-
108
-
109
-
110
-
111
-
112
 |
 |
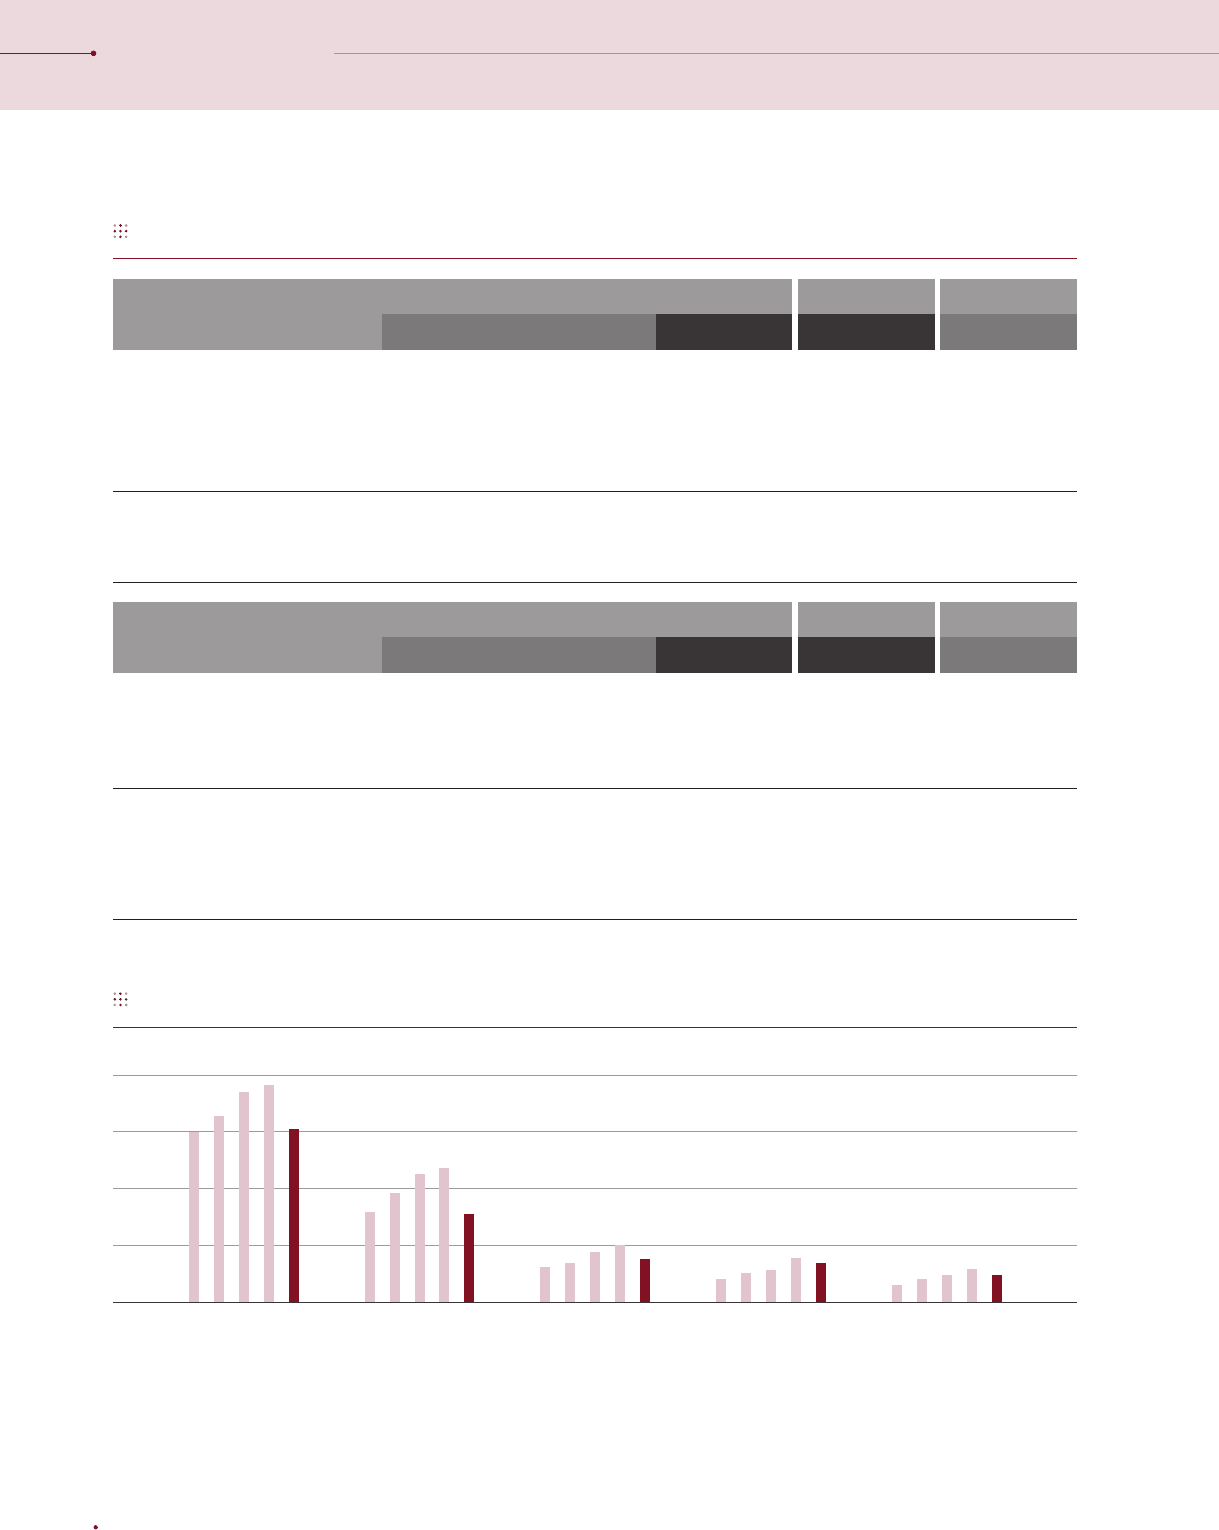
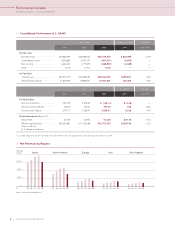
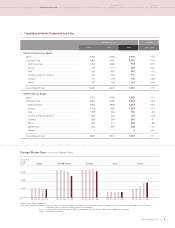
Consolidated Performance (U.S. GAAP)
−21.9
—
—
—
−10.5
−15.2
% change
2008vs2009
$ 208,995
(4,693)
(4,448)
—
$295,857
102,425
U.S. dollars* in millions
2009
¥20,529,570
(461,011)
(436,937)
−4.0%
¥29,062,037
10,061,207
Yen in millions
200920082007
Yen
200920082007
% change
2008vs2009
U.S. dollars*
2009
¥26,289,240
2,270,375
1,717,879
14.5%
¥32,458,320
11,869,527
¥23,948,091
2,238,683
1,644,032
14.7%
¥32,574,779
11,836,092
For the Year:
Net Revenues .................................
Operating Income .........................
Net Income ....................................
ROE .................................................
At Year-End:
Total Assets ....................................
Shareholders' Equity .....................
—
−28.6
−14.9
−37.2
−37.2
$ (1.42)
1.02
32.66
$31.76
$109,516
¥ (139.13)
100.00
3,208.41
¥3,120
¥10,757,752
¥ 540.65
140.00
3,768.97
¥4,970
¥17,136,548
¥ 512.09
120.00
3,701.17
¥7,550
¥27,255,481
Per Share Data:
Net Income (Basic) .........................
Annual Cash Dividends .................
Shareholders' Equity .....................
Stock Information (March 31):
Stock Price ......................................
Market Capitalization ....................
(Yen in millions,
U.S. dollars in millions)
* U.S. dollar amounts have been translated at the rate of ¥98.23=US$1, the approximate current exchange rate at March 31, 2009.
Net Revenues by Regions
Japan North America Europe Asia Other Regions
0
4,000
8,000
12,000
16,000
(¥ Billion)
’08’07 ’09’06’05 ’08’07 ’09’06’05 ’08’07 ’09’06’05 ’08’07 ’09’06’05 ’08’07 ’09’06’05FY
Note: Fiscal years ended March 31
Toyota Motor Corporation Fiscal years ended March 31
Performance Overview
TOYOTA MOTOR CORPORATION
8