Toyota 2009 Annual Report Download - page 53
Download and view the complete annual report
Please find page 53 of the 2009 Toyota annual report below. You can navigate through the pages in the report by either clicking on the pages listed below, or by using the keyword search tool below to find specific information within the annual report.-
 1
1 -
2
-
3
-
4
-
5
-
6
-
7
-
8
-
9
-
10
-
11
-
12
-
13
-
14
-
15
-
16
-
17
-
18
-
19
-
20
-
21
-
22
-
23
-
24
-
25
-
26
-
27
-
28
-
29
-
30
-
31
-
32
-
33
-
34
-
35
-
36
-
37
-
38
-
39
-
40
-
41
-
42
-
 43
43 -
 44
44 -
 45
45 -
 46
46 -
 47
47 -
 48
48 -
 49
49 -
 50
50 -
 51
51 -
 52
52 -
 53
53 -
 54
54 -
 55
55 -
 56
56 -
 57
57 -
 58
58 -
 59
59 -
 60
60 -
 61
61 -
 62
62 -
 63
63 -
64
-
65
-
66
-
67
-
68
-
69
-
70
-
71
-
72
-
73
-
74
-
75
-
76
-
77
-
78
-
79
-
80
-
81
-
82
-
83
-
84
-
85
-
86
-
87
-
88
-
89
-
90
-
91
-
92
-
93
-
94
-
95
-
96
-
97
-
98
-
99
-
100
-
101
-
102
-
103
-
104
-
105
-
106
-
107
-
108
-
109
-
110
-
111
-
112
 |
 |

The Right Way Forward Business OverviewPerformance Overview Financial Section
Investor
Information
Management &
Corporate Information
Top Messages
Annual Report 2009 51
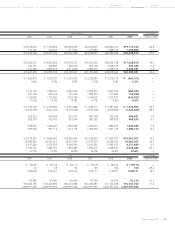
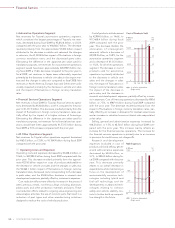
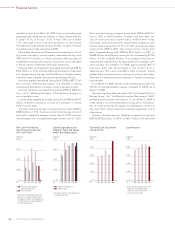
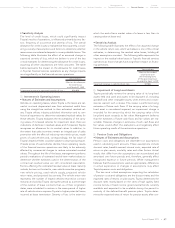
Operating Income and Loss
Toyota’s operating income
decreased by ¥2,731.3 billion to
an operating loss of ¥461.0 bil-
lion during fiscal 2009 compared
with the prior year. This operat-
ing loss was unfavorably affected
by the decrease in vehicle unit
sales, the changes in sales mix,
the increased expenses and the
impact of the decrease in parts
sales, partially offset by the
decrease in research and devel-
opment expenses.
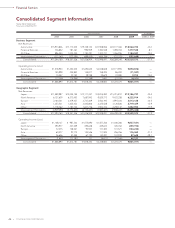
During fiscal 2009, operating
income (before the elimination of
intersegment profits) for signifi-
cant geographic regions
decreased by ¥1,677.8 billion in
Japan, decreased by ¥695.5 bil-
lion in North America, decreased
by ¥284.8 billion in Europe, decreased by ¥80.3 billion, or 31.3%,
in Asia, and decreased by ¥56.3 billion, or 39.1% in Other com-
pared with the prior year. The decrease in Japan was mainly due
to decreases in both production volume and vehicle unit sales in
the export markets, partially offset by the decrease in research
and development expenses. The decrease in North America
was mainly due to decreases in both production volume and
vehicle unit sales, the increases in the provision for credit losses,
net charge-offs and allowance for residual value losses in sales
finance subsidiaries in the United States, partially offset by the
impact of the fluctuations in foreign currency translation rates.
The decrease in Europe was mainly due to decreases in both
production volume and vehicle unit sales, partially offset by the
impact of fluctuations in foreign currency translation rates. The
decrease in Asia was mainly due to decreases in both produc-
tion volume and vehicle unit sales, and the impact of the fluctu-
ations in foreign currency translation rates. The decrease in
Other was primarily due to the decrease in vehicle unit sales.
The following is a discussion of operating income for each of
Toyota’s business segments. The operating income amounts
discussed are before the elimination of intersegment profits.
• Automotive Operations Segment
Operating income from Toyota’s automotive operations
decreased by ¥2,566.7 billion to an operating loss of ¥394.8 bil-
lion during fiscal 2009 compared with the prior year. This
decrease was primarily attributed to the decrease in vehicle unit
sales, the changes in sales mix, the increased expenses, and the
impact of the decrease in parts sales, partially offset by the
decrease in research and development expenses.
• Financial Services Operations Segment
Operating income from Toyota’s financial services operations
decreased by ¥158.5 billion to an operating loss of ¥72.0 billion
during fiscal 2009 compared with the prior year. This decrease
was primarily due to the increases in the provision for credit
losses, net charge-offs and allowance for residual value losses,
and the increase in valuation losses on interest rate swaps stated
at fair value in sales finance subsidiaries, partially offset by the
impact of a higher volume of financing activities.
• All Other Operations Segment
Operating income from Toyota’s other operations segment
decreased by ¥23.1 billion, or 70.0% to ¥9.9 billion during fiscal
2009 compared with the prior year.
Other Income and Expenses
Interest and dividend income decreased by ¥27.3 billion, or
16.4%, to ¥138.4 billion during fiscal 2009 compared with the
prior year mainly due to a decrease in interest income from mar-
ketable securities.
Interest expense increased by ¥0.8 billion, or 1.7%, to ¥46.9
billion during fiscal 2009 compared with the prior year.
Foreign exchange gains, net decreased by ¥11.0 billion to a
loss of ¥1.8 billion during fiscal 2009 compared with the prior
year. Foreign exchange gains and losses include the differences
between the value of foreign currency denominated sales trans-
lated at prevailing exchange rates and the value of the sales
amounts settled during the year, including those settled using
forward foreign currency exchange contracts.
Other income, net decreased by ¥227.2 billion to a loss of
¥189.1 billion during fiscal 2009 compared with the prior year.
This decrease was mainly due to the recognition of impairment
losses on available-for sale securities.
Income Taxes
The provision for income taxes decreased by ¥968.0 billion to a
tax benefit of ¥56.5 billion during fiscal 2009 compared with the
prior year primarily due to the decrease in income before
income taxes. The effective tax rate was 10.1%, which was lower
than its statutory tax rate in Japan primarily due to a recognition
of valuation allowance for deferred tax assets at domestic and
overseas subsidiaries.
Minority Interest in Consolidated Subsidiaries and
Equity in Earnings of Affi liated Companies
Minority interest in consolidated subsidiaries decreased by
¥102.2 billion to a loss of ¥24.2 billion during fiscal 2009 com-
pared with the prior year. This decrease was mainly due to a
decrease in net income at consolidated subsidiaries.
Equity in earnings of affiliated companies during fiscal 2009
decreased by ¥227.4 billion, or 84.2%, to ¥42.7 billion compared
with the prior year. This decrease was due to a decrease in net
income at the affiliated companies.
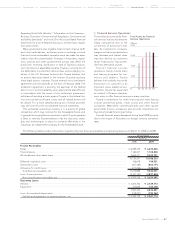
Operating Income (Loss)
(¥ Billion)
’08’07 ’09’06’05FY
2,500
2,000
1,500
500
-500
1,000
0
20
(%)
16
12
4
-4
8
0
% of net revenues (Ri
g
ht scale)