Toyota 2009 Annual Report Download - page 52
Download and view the complete annual report
Please find page 52 of the 2009 Toyota annual report below. You can navigate through the pages in the report by either clicking on the pages listed below, or by using the keyword search tool below to find specific information within the annual report.-
 1
1 -
2
-
3
-
4
-
5
-
6
-
7
-
8
-
9
-
10
-
11
-
12
-
13
-
14
-
15
-
16
-
17
-
18
-
19
-
20
-
21
-
22
-
23
-
24
-
25
-
26
-
27
-
28
-
29
-
30
-
31
-
32
-
33
-
34
-
35
-
36
-
37
-
38
-
39
-
40
-
41
-
 42
42 -
 43
43 -
 44
44 -
 45
45 -
 46
46 -
 47
47 -
 48
48 -
 49
49 -
 50
50 -
 51
51 -
 52
52 -
 53
53 -
 54
54 -
 55
55 -
 56
56 -
 57
57 -
 58
58 -
 59
59 -
 60
60 -
 61
61 -
 62
62 -
63
-
64
-
65
-
66
-
67
-
68
-
69
-
70
-
71
-
72
-
73
-
74
-
75
-
76
-
77
-
78
-
79
-
80
-
81
-
82
-
83
-
84
-
85
-
86
-
87
-
88
-
89
-
90
-
91
-
92
-
93
-
94
-
95
-
96
-
97
-
98
-
99
-
100
-
101
-
102
-
103
-
104
-
105
-
106
-
107
-
108
-
109
-
110
-
111
-
112
 |
 |

Financial Section
TOYOTA MOTOR CORPORATION
50
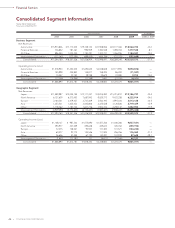
• Automotive Operations Segment
Net revenues for Toyota’s automotive operations segment,
which constitute the largest percentage of Toyota’s net reve-
nues, decreased during fiscal 2009 by ¥5,612.6 billion, or 23.2%
compared with the prior year to ¥18,564.7 billion. The decrease
resulted primarily from the approximate ¥3,400 billion impact
attributed to the decrease in vehicle unit sales and the changes
in sales mix, the ¥1,833.8 billion impact of fluctuations in foreign
currency translation rates, and the decreased parts sales.
Eliminating the difference in the Japanese yen value used for
translation purposes, net revenues for its automotive operations
segment would have been approximately ¥20,398.5 billion dur-
ing fiscal 2009, a 15.6% decrease compared to the prior year. In
fiscal 2009, net revenues in Japan were unfavorably impacted
primarily by the decrease in vehicle unit sales in the export mar-
kets and the changes in sales mix compared to fiscal 2008. Net
revenues in North America, Europe, Asia and Other were unfa-
vorably impacted primarily by the decrease in vehicle unit sales
and the impact of fluctuations in foreign currency translation
rates.
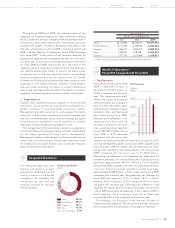
• Financial Services Operations Segment
Net revenues in fiscal 2009 for Toyota’s financial services opera-
tions decreased by ¥120.8 billion, or 8.1% compared to the prior
year to ¥1,377.5 billion. This decrease resulted primarily from the
impact of fluctuations in foreign currency translation rates, par-
tially offset by the impact of a higher volume of financings.
Eliminating the difference in the Japanese yen value used for
translation purposes, net revenues for its financial services oper-
ations would have been approximately ¥1,572.5 billion during
fiscal 2009, a 5.0% increase compared with the prior year.
• All Other Operations Segment
Net revenues for Toyota’s other operations segment decreased
by ¥162.0 billion, or 12.0%, to ¥1,184.9 billion during fiscal 2009
compared with the prior year.
Operating Costs and Expenses
Operating costs and expenses decreased by ¥3,028.4 billion, or
12.6%, to ¥20,990.5 billion during fiscal 2009 compared with the
prior year. This decrease resulted primarily from the approxi-
mate ¥2,100 billion impact on costs of products attributable to
the decrease in vehicle unit sales and the changes in sales mix,
the ¥2,062.1 billion impact of fluctuations in foreign currency
translation rates, decreased costs corresponding to the decrease
in parts sales, and the ¥54.8 billion decrease in research and
development expenses, partially offset by increases in expenses.
Cost reduction efforts were offset by increases in the prices of
steel, precious metals, non-ferrous alloys including aluminum,
plastic parts and other production materials and parts. These
cost reduction efforts related to ongoing value engineering and
value analysis activities, the use of common parts that result in a
reduction of part types and other manufacturing initiatives
designed to reduce the costs of vehicle production.
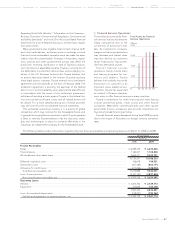
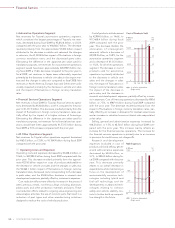
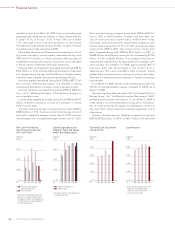
Cost of products sold decreased
by ¥2,984.0 billion, or 14.6%, to
¥17,468.4 billion during fiscal
2009 compared with the prior
year. This decrease (before the
elimination of intersegment
amounts) reflects a decrease of
¥2,939.2 billion, or 14.9%, for the
automotive operations segment
and a decrease of ¥131.2 billion,
or 11.2%, for all other operations
segment. The decrease in cost of
products sold for automotive
operations is primarily attributed
to the decrease in vehicle unit
sales and the changes in sales
mix, the impact of fluctuations in
foreign currency translation rates,
the impact of the decrease in
parts sales, and the decrease in
research and development expenses, partially offset by increas-
es in expenses. Cost of financing operations decreased by ¥80.6
billion, or 7.5%, to ¥987.4 billion during fiscal 2009 compared
with the prior year. The decrease resulted primarily from the
impact of fluctuations in foreign currency translation rates, par-
tially offset by an increase in allowance for residual value losses
and an increase in valuation losses on interest rate swaps stated
at fair value.
Selling, general and administrative expenses increased by
¥36.2 billion, or 1.5%, to ¥2,534.7 billion during fiscal 2009 com-
pared with the prior year. This increase mainly reflects an
increase for the financial services operations. The increase for
the financial services operations is primarily due to an increase
in provision for credit losses, net charge-offs.
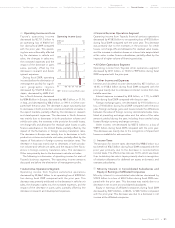
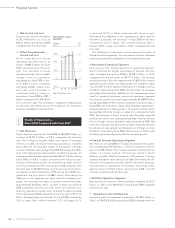
Research and development
expenses (included in cost of
products sold and selling, gener-
al and administrative expenses)
decreased by ¥54.8 billion, or
5.7%, to ¥904.0 billion during fis-
cal 2009 compared with the prior
year. This decrease primarily
relates to an overall decrease in
expenditures while maintaining a
focus on the development of
environmentally conscious tech-
nologies including hybrid and
fuel-cell technology, and the
developments in advanced tech-
nologies relating to collision
safety and vehicle stability con-
trols to further build up competi-
tive strength in the future.
Cost of Products Sold
0
4,000
8,000
12,000
16,000
20,000
(¥ Billion)
’08’07 ’09’06’05FY
0
20
40
60
80
100
(%)
% of sales of products
(Ri
g
ht scale)
R&D Expenses
0
250
500
750
1,000
(¥ Billion)
’08’07 ’09’06’05FY
0
3
6
9
12
(%)
% of sales of products
(Ri
g
ht scale)