Toyota 2009 Annual Report Download - page 92
Download and view the complete annual report
Please find page 92 of the 2009 Toyota annual report below. You can navigate through the pages in the report by either clicking on the pages listed below, or by using the keyword search tool below to find specific information within the annual report.-
 1
1 -
2
-
3
-
4
-
5
-
6
-
7
-
8
-
9
-
10
-
11
-
12
-
13
-
14
-
15
-
16
-
17
-
18
-
19
-
20
-
21
-
22
-
23
-
24
-
25
-
26
-
27
-
28
-
29
-
30
-
31
-
32
-
33
-
34
-
35
-
36
-
37
-
38
-
39
-
40
-
41
-
42
-
43
-
44
-
45
-
46
-
47
-
48
-
49
-
50
-
51
-
52
-
53
-
54
-
55
-
56
-
57
-
58
-
59
-
60
-
61
-
62
-
63
-
64
-
65
-
66
-
67
-
68
-
69
-
70
-
71
-
72
-
73
-
74
-
75
-
76
-
77
-
78
-
79
-
80
-
81
-
 82
82 -
 83
83 -
 84
84 -
 85
85 -
 86
86 -
 87
87 -
 88
88 -
 89
89 -
 90
90 -
 91
91 -
 92
92 -
 93
93 -
 94
94 -
 95
95 -
 96
96 -
 97
97 -
 98
98 -
 99
99 -
 100
100 -
 101
101 -
 102
102 -
103
-
104
-
105
-
106
-
107
-
108
-
109
-
110
-
111
-
112
 |
 |
Financial Section
TOYOTA MOTOR CORPORATION
90
Toyota’s policy and objective for plan asset management is to
maximize returns on plan assets to meet future benefit payment
requirements under risks which Toyota considers permissible.
Asset allocations under the plan asset management are deter-
mined based on Toyota’s plan asset management guidelines
which are established to achieve the optimized asset composi-
tions in terms of the long-term overall plan asset management.
Prior to making individual investments, Toyota performs in-depth
assessments of corresponding factors including risks, transaction
costs and liquidity of each potential investment under consider-
ation. To measure the performance of the plan asset manage-
ment, Toyota establishes bench mark return rates for each
individual investment, combines these individual bench mark
rates based on the asset composition ratios within each asset
category, and compares the combined rates with the corre-
sponding actual return rates on each asset category.
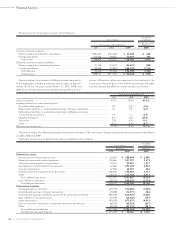
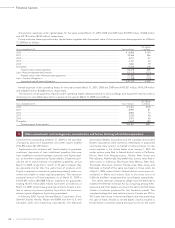
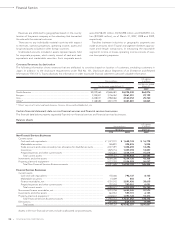
Toyota expects to contribute ¥95,270 million ($970 million) to
its pension plan in the year ending March 31, 2010.
The following pension benefit payments, which reflect expect-
ed future service, as appropriate, are expected to be paid:
The expected rate of return on plan assets is determined after
considering several applicable factors including, the composi-
tion of plan assets held, assumed risks of asset management,
historical results of the returns on plan assets, Toyota’s principal
policy for plan asset management, and forecasted market con-
ditions.
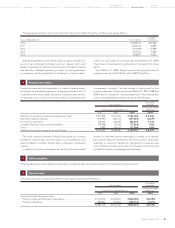
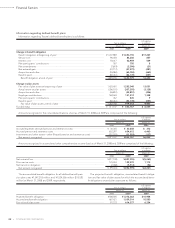
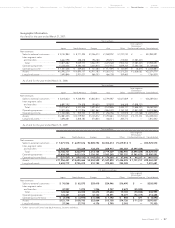
Toyota’s pension plan weighted-average asset allocations as
of March 31, 2008 and 2009, by asset category are as follows:
Plan assets at March 31,
2008 2009
Equity securities ......................................................................................................................................................... 60.5% 49.4%
Debt securities ........................................................................................................................................................... 25.2 30.9
Real estate .................................................................................................................................................................. 1.3 0.3
Other........................................................................................................................................................................... 13.0 19.4
Total ........................................................................................................................................................................ 100.0% 100.0%
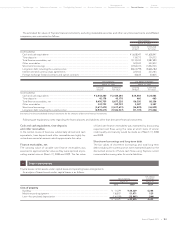
Postretirement benefi ts other than pensions
and postemployment benefi ts
Toyota’s U.S. subsidiaries provide certain health care and life
insurance benefits to eligible retired employees. In addition,
Toyota provides benefits to certain former or inactive employees
after employment, but before retirement. These benefits are
currently unfunded and provided through various insurance
companies and health care providers. The costs of these bene-
fits are recognized over the period the employee provides cred-
ited service to Toyota. Toyota’s obligations under these
arrangements are not material.
U.S. dollars
Years ending March 31, Yen in millions in millions
2010................................................................................................................................................................................... ¥ 82,172 $ 836
2011................................................................................................................................................................................... 79,359 808
2012................................................................................................................................................................................... 75,919 773
2013................................................................................................................................................................................... 74,882 762
2014................................................................................................................................................................................... 77,278 787
from 2015 to 2019 ............................................................................................................................................................ 431,993 4,398
Total .............................................................................................................................................................................. ¥821,603 $8,364
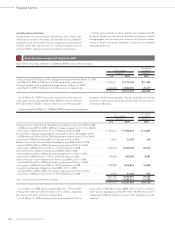
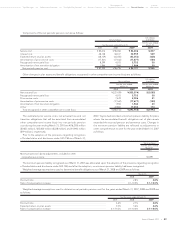
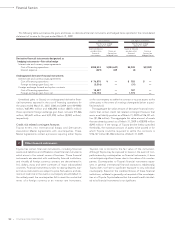
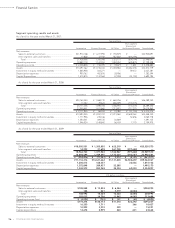
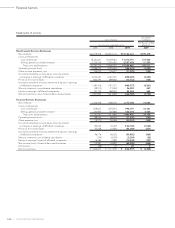
Toyota adopted FAS 161 in the fiscal year ended March 31, 2009.
Toyota employs derivative financial instruments, including for-
eign exchange forward contracts, foreign currency options,
interest rate swaps, interest rate currency swap agreements and
interest rate options to manage its exposure to fluctuations in
interest rates and foreign currency exchange rates. Toyota does
not use derivatives for speculation or trading.
Fair value hedges
Toyota enters into interest rate swaps and interest rate currency
swap agreements mainly to convert its fixed-rate debt to vari-
able-rate debt. Toyota uses interest rate swap agreements in
managing interest rate risk exposure. Interest rate swap agree-
ments are executed as either an integral part of specific debt
transactions or on a portfolio basis. Toyota uses interest rate
currency swap agreements to hedge exposure to currency
exchange rate fluctuations on principal and interest payments
for borrowings denominated in foreign currencies. Notes and
loans payable issued in foreign currencies are hedged by con-
currently executing interest rate currency swap agreements,
which involve the exchange of foreign currency principal and
interest obligations for each functional currency obligations at
agreed-upon currency exchange and interest rates.
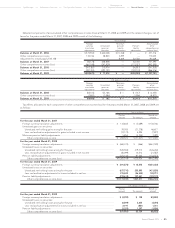
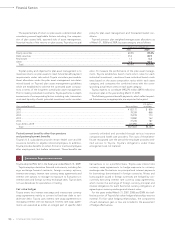
For the years ended March 31, 2007, 2008 and 2009, the inef-
fective portion of Toyota’s fair value hedge relationships was not
material. For fair value hedging relationships, the components
of each derivative’s gain or loss are included in the assessment
of hedge effectiveness.
Derivative financial instruments:
20