Toyota 2009 Annual Report Download - page 57
Download and view the complete annual report
Please find page 57 of the 2009 Toyota annual report below. You can navigate through the pages in the report by either clicking on the pages listed below, or by using the keyword search tool below to find specific information within the annual report.-
 1
1 -
2
-
3
-
4
-
5
-
6
-
7
-
8
-
9
-
10
-
11
-
12
-
13
-
14
-
15
-
16
-
17
-
18
-
19
-
20
-
21
-
22
-
23
-
24
-
25
-
26
-
27
-
28
-
29
-
30
-
31
-
32
-
33
-
34
-
35
-
36
-
37
-
38
-
39
-
40
-
41
-
42
-
43
-
44
-
45
-
46
-
 47
47 -
 48
48 -
 49
49 -
 50
50 -
 51
51 -
 52
52 -
 53
53 -
 54
54 -
 55
55 -
 56
56 -
 57
57 -
 58
58 -
 59
59 -
 60
60 -
 61
61 -
 62
62 -
 63
63 -
 64
64 -
 65
65 -
 66
66 -
 67
67 -
68
-
69
-
70
-
71
-
72
-
73
-
74
-
75
-
76
-
77
-
78
-
79
-
80
-
81
-
82
-
83
-
84
-
85
-
86
-
87
-
88
-
89
-
90
-
91
-
92
-
93
-
94
-
95
-
96
-
97
-
98
-
99
-
100
-
101
-
102
-
103
-
104
-
105
-
106
-
107
-
108
-
109
-
110
-
111
-
112
 |
 |

The Right Way Forward Business OverviewPerformance Overview Financial Section
Investor
Information
Management &
Corporate Information
Top Messages
Annual Report 2009 55
The foregoing statements are forward-looking statements
based upon Toyota’s management’s assumptions and beliefs
regarding exchange rates, market demand for Toyota’s prod-
ucts, economic conditions and others. Please see “Cautionary
Statement Concerning Forward-Looking Statements”. Toyota’s
actual results of operations could vary significantly from those
described above as a result of unanticipated changes in the fac-
tors described above or other factors, including those described
in “Risk Factors”.
Liquidity and Capital Resources
Historically, Toyota has funded its capital expenditures and
research and development activities primarily through cash gen-
erated by operations. In fiscal 2009, cash generated by opera-
tions decreased due to a decrease in vehicle unit sales that was
attributed to the rapid contraction of the automotive market.
Therefore, Toyota funded cash partially through additional loans
and issuance of notes.
In fiscal 2010, Toyota expects to sufficiently fund its capital
expenditures and research and development activities primarily
through cash and cash equivalents on hand, cash generated by
operations, loans and issuance of notes. Toyota will use its funds
for the development of environment technologies, maintenance
and replacement of manufacturing facilities, and the introduc-
tion of new products. See “Information on the Company—
Business Overview—Capital Expenditures and Divestitures” in
Toyota’s annual report on Form 20-F for information regarding
Toyota’s material capital expenditures and divestitures for fiscal
2007, 2008 and 2009, and information concerning Toyota’s prin-
cipal capital expenditures and divestitures currently in progress.
Toyota funds its financing programs for customers and dealers,
including loans and leasing programs, from both cash generated
by operations and borrowings by its finance subsidiaries. Toyota
seeks to expand its ability to raise funds locally in markets through-
out the world by expanding its network of finance subsidiaries.
Net cash provided by operating activities was ¥1,476.9 billion
for fiscal 2009, compared with ¥2,981.6 billion for the prior year.
The decrease in net cash provided by operating activities result-
ed primarily from a decrease in cash collection received from
sale of products due to a decrease in net revenue for the auto-
motive operations, partially offset by a decrease in cash pay-
ments for cost of products sold within the automotive operations
and a decrease in cash payments for income taxes.
Net cash used in investing activities was ¥1,230.2 billion for
fiscal 2009, compared with ¥3,874.8 billion for the prior year. The
decrease in net cash used in investing activities resulted primari-
ly from a decrease in additions to finance receivables, a
decrease in purchases of marketable securities and security
investments, and an increase in proceeds from sales of market-
able securities and security investments.
Net cash provided by financing activities was ¥698.8 billion for
fiscal 2009, compared with ¥706.1 billion for the prior year. The
decrease in net cash provided by financing activities resulted
primarily from an increase in payments of long-term debt, par-
tially offset by a decrease in repurchase of common stock.
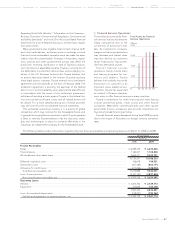
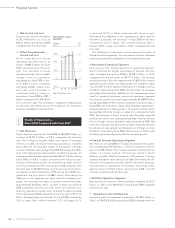
Total capital expenditures for property, plant and equipment,
excluding vehicles and equipment on operating leases, were
¥1,364.5 billion during fiscal 2009, a decrease of 7.8% over the
¥1,480.5 billion in total capital expenditures from the prior year.
The decrease in capital expenditures resulted primarily from a
decrease in investments by subsidiaries especially located in
Asia and North America.
Total expenditures for vehicles and equipment on operating
leases were ¥960.3 billion during fiscal 2009, a decrease of 24.9%
over the ¥1,279.4 billion in expenditures from the prior year.
The decrease in expenditures for vehicles and equipment on
operating leases resulted primarily from a decrease in invest-
ments in the financial services operations.
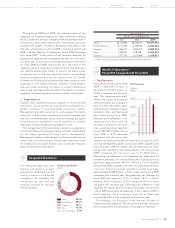
Toyota expects investments in property, plant and equipment,
excluding vehicles and equipment on operating leases, to be
approximately ¥830.0 billion during fiscal 2010. Toyota’s expect-
ed investments include approximately ¥530.0 billion in Japan,
¥140.0 billion in North America, ¥50.0 billion in Europe, ¥70.0
billion in Asia and ¥40.0 billion in Other.
Based on current available information, Toyota does not
expect environmental matters to have a material impact on its
financial position, results of operations, liquidity or cash flows
during fiscal 2010. However, there exists a substantial amount of
uncertainty with respect to Toyota’s obligations under current
and future environment regulations as described in “Information
on the Company—Business Overview—Governmental Regulations,
Environmental and Safety Standards” in Toyota’s annual report
on Form 20-F.
Cash and cash equivalents were ¥2,444.2 billion as of March
31, 2009. Most of Toyota’s cash and cash equivalents are held in
Japanese yen and in U.S. dollars. In addition, time deposits
were ¥45.1 billion and marketable securities were ¥495.3 billion
as of March 31, 2009.
Liquid assets, which Toyota defines as cash and cash equiva-
lents, time deposits, marketable debt securities and its invest-
ment in monetary trust funds, decreased during fiscal 2009 by
¥251.8 billion, or 5.6%, to ¥4,229.1 billion.
Trade accounts and notes receivable, net decreased during
fiscal 2009 by ¥647.5 billion, or 31.7%, to ¥1,392.7 billion, reflect-
ing the impacts of decreased revenues and fluctuations in for-
eign currency translation rates.
Inventories decreased during fiscal 2009 by ¥366.4 billion, or
20.1%, to ¥1,459.3 billion, reflecting the impacts of decreased
volumes and fluctuations in foreign currency translation rates.
Total finance receivables, net decreased during fiscal 2009 by
¥728.9 billion, or 7.1%, to ¥9,546.9 billion. The decrease in finance
receivables, net resulted from a decrease in wholesale and other
dealer loans and the impact of fluctuations in foreign currency