Toyota 2009 Annual Report Download - page 111
Download and view the complete annual report
Please find page 111 of the 2009 Toyota annual report below. You can navigate through the pages in the report by either clicking on the pages listed below, or by using the keyword search tool below to find specific information within the annual report.-
 1
1 -
2
-
3
-
4
-
5
-
6
-
7
-
8
-
9
-
10
-
11
-
12
-
13
-
14
-
15
-
16
-
17
-
18
-
19
-
20
-
21
-
22
-
23
-
24
-
25
-
26
-
27
-
28
-
29
-
30
-
31
-
32
-
33
-
34
-
35
-
36
-
37
-
38
-
39
-
40
-
41
-
42
-
43
-
44
-
45
-
46
-
47
-
48
-
49
-
50
-
51
-
52
-
53
-
54
-
55
-
56
-
57
-
58
-
59
-
60
-
61
-
62
-
63
-
64
-
65
-
66
-
67
-
68
-
69
-
70
-
71
-
72
-
73
-
74
-
75
-
76
-
77
-
78
-
79
-
80
-
81
-
82
-
83
-
84
-
85
-
86
-
87
-
88
-
89
-
90
-
91
-
92
-
93
-
94
-
95
-
96
-
97
-
98
-
99
-
100
-
 101
101 -
 102
102 -
 103
103 -
 104
104 -
 105
105 -
 106
106 -
 107
107 -
 108
108 -
 109
109 -
 110
110 -
 111
111 -
 112
112
 |
 |
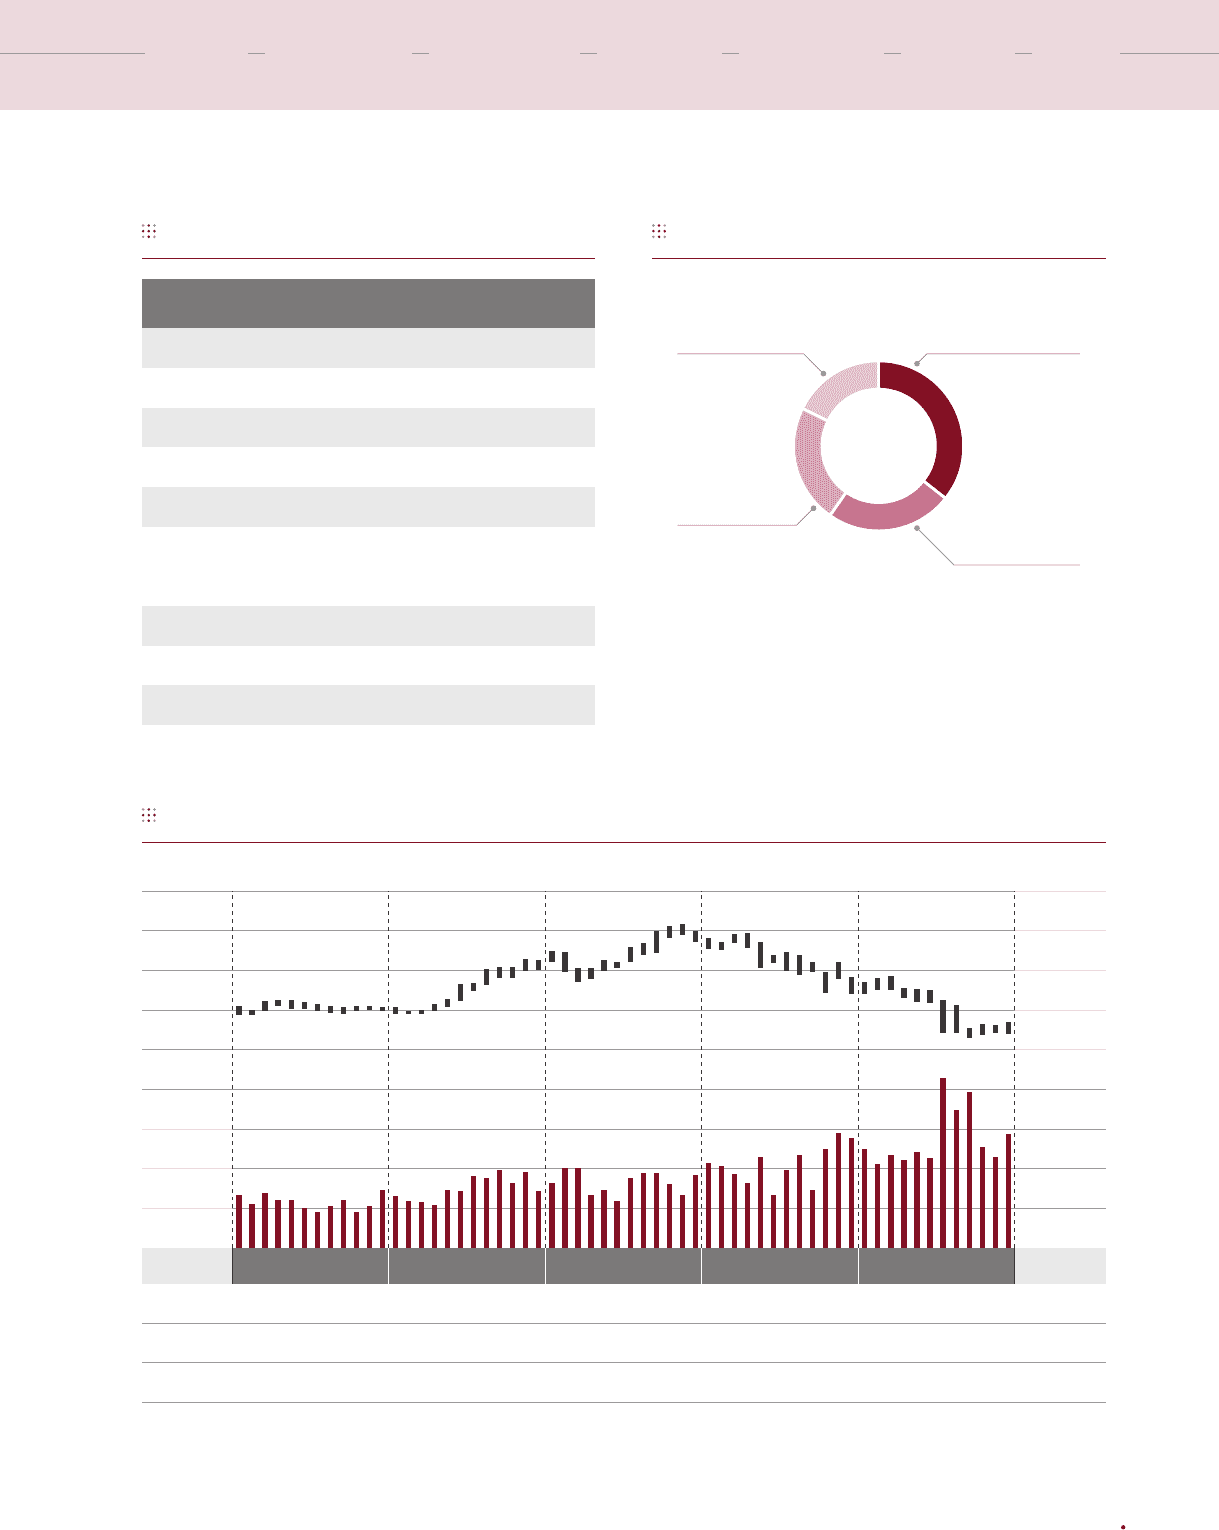
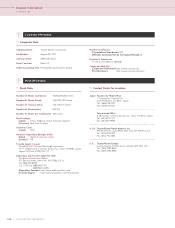
Major Shareholders (Top 10)
Toyota’s Stock Price and Trading Volume on the Tokyo Stock Exchange
Ownership Breakdown
Japan Trustee Services Bank, Ltd.
Toyota Industries Corporation
The Master Trust Bank of Japan, Ltd.
Nippon Life Insurance Company
State Street Bank and Trust Company
The Bank of New York Mellon
as Depositary Bank
for Depositary Receipt Holders
Trust & Custody Services Bank, Ltd.
Tokio Marine & Nichido Fire Insurance Co., Ltd.
Mitsui Sumitomo Insurance Company, Limited
JPMorgan Chase Bank
353,082
201,195
192,363
130,791
119,887
85,081
84,527
83,821
65,166
60,854
Name Number of Shares Held
(Thousands)
10,000
8,000
6,000
4,000
2,000
0
Stock price (¥)
400
300
200
100
0
Trading volume
(Million shares)
FY 2005 FY 2006 FY 2007 FY 2009FY 2008
4,520 6,560 8,350 7,880 5,710
High (¥)
3,730 3,790 5,430 4,810 2,585
Low (¥)
3,990 6,430 7,550 4,970 3,120
At Year-End (¥)
Note: Individuals, etc. includes shares of 312 million treasury stock.
35.7%
Financial institutions,
Brokerages
17.6%
Other corporate
entities
24.1%
Foreign corporate
entities and others
22.6%
Individuals, etc.
Note: Fiscal years ended March 31
The Right Way Forward Business OverviewPerformance Overview Financial Section
Investor
Information
Management &
Corporate Information
Top Messages
Annual Report 2009 109