Toyota 2009 Annual Report Download - page 70
Download and view the complete annual report
Please find page 70 of the 2009 Toyota annual report below. You can navigate through the pages in the report by either clicking on the pages listed below, or by using the keyword search tool below to find specific information within the annual report.-
 1
1 -
2
-
3
-
4
-
5
-
6
-
7
-
8
-
9
-
10
-
11
-
12
-
13
-
14
-
15
-
16
-
17
-
18
-
19
-
20
-
21
-
22
-
23
-
24
-
25
-
26
-
27
-
28
-
29
-
30
-
31
-
32
-
33
-
34
-
35
-
36
-
37
-
38
-
39
-
40
-
41
-
42
-
43
-
44
-
45
-
46
-
47
-
48
-
49
-
50
-
51
-
52
-
53
-
54
-
55
-
56
-
57
-
58
-
59
-
 60
60 -
 61
61 -
 62
62 -
 63
63 -
 64
64 -
 65
65 -
 66
66 -
 67
67 -
 68
68 -
 69
69 -
 70
70 -
 71
71 -
 72
72 -
 73
73 -
 74
74 -
 75
75 -
 76
76 -
 77
77 -
 78
78 -
 79
79 -
 80
80 -
81
-
82
-
83
-
84
-
85
-
86
-
87
-
88
-
89
-
90
-
91
-
92
-
93
-
94
-
95
-
96
-
97
-
98
-
99
-
100
-
101
-
102
-
103
-
104
-
105
-
106
-
107
-
108
-
109
-
110
-
111
-
112
 |
 |

Financial Section
TOYOTA MOTOR CORPORATION
68
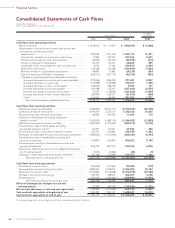
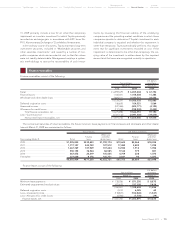
Consolidated Statements of Cash Flows
U.S. dollars
Yen in millions in millions
2007 2008 2009 2009
Cash flows from operating activities
Net income (loss) ............................................................................... ¥ 1,644,032 ¥ 1,717,879 ¥ (436,937) $ (4,448)
Adjustments to reconcile net income (loss) to net cash
provided by operating activities
Depreciation ................................................................................... 1,382,594 1,491,135 1,495,170 15,221
Provision for doubtful accounts and credit losses ...................... 71,862 122,790 257,433 2,621
Pension and severance costs, less payments .............................. (32,054) (54,341) (20,958) (213)
Losses on disposal of fixed assets ................................................ 50,472 45,437 68,682 699
Unrealized losses on available-for-sale securities, net ................ 4,614 11,346 220,920 2,249
Deferred income taxes .................................................................. 132,308 81,458 (194,990) (1,985)
Minority interest in consolidated subsidiaries ............................. 49,687 77,962 (24,278) (247)
Equity in earnings of affiliated companies ................................... (209,515) (270,114) (42,724) (435)
Changes in operating assets and liabilities, and other
(Increase) decrease in accounts and notes receivable ............ (212,856) (206,793) 791,481 8,057
(Increase) decrease in inventories ............................................. (133,698) (149,984) 192,379 1,958
(Increase) decrease in other current assets .............................. (108,767) (82,737) 9,923 101
Increase (decrease) in accounts payable .................................. 104,188 62,241 (837,402) (8,525)
Increase (decrease) in accrued income taxes .......................... 74,255 (118,030) (251,868) (2,564)
Increase (decrease) in other current liabilities ......................... 264,490 206,911 (41,819) (426)
Other ........................................................................................... 156,561 46,464 291,893 2,972
Net cash provided by operating activities ........................... 3,238,173 2,981,624 1,476,905 15,035
Cash flows from investing activities
Additions to finance receivables ...................................................... (7,489,096) (8,647,717) (7,700,459) (78,392)
Collection of finance receivables ..................................................... 6,190,661 7,223,573 7,232,152 73,625
Proceeds from sale of finance receivables ...................................... 84,083 109,124 11,290 115
Additions to fixed assets excluding equipment
leased to others ............................................................................... (1,425,814) (1,480,570) (1,364,582) (13,892)
Additions to equipment leased to others ....................................... (1,264,381) (1,279,405) (960,315) (9,776)
Proceeds from sales of fixed assets excluding
equipment leased to others............................................................ 64,421 67,551 47,386 482
Proceeds from sales of equipment leased to others ...................... 321,761 375,881 528,749 5,383
Purchases of marketable securities and security investments ....... (1,068,205) (1,151,640) (636,030) (6,475)
Proceeds from sales of marketable securities and
security investments ........................................................................ 148,442 165,495 800,422 8,148
Proceeds upon maturity of marketable securities and
security investments ........................................................................ 676,729 821,915 675,455 6,876
Payment for additional investments in affiliated companies,
net of cash acquired ........................................................................ (1,651) (4,406) (45) (0)
Changes in investments and other assets, and other ..................... (51,328) (74,687) 135,757 1,382
Net cash used in investing activities ..................................... (3,814,378) (3,874,886) (1,230,220) (12,524)
Cash flows from financing activities
Purchase of common stock ............................................................... (295,699) (311,667) (70,587) (719)
Proceeds from issuance of long-term debt ..................................... 2,890,000 3,349,812 3,506,990 35,702
Payments of long-term debt ............................................................. (1,726,823) (2,310,008) (2,704,078) (27,528)
Increase in short-term borrowings ................................................... 353,397 408,912 406,507 4,138
Dividends paid ................................................................................... (339,107) (430,860) (439,991) (4,479)
Net cash provided by financing activities ............................ 881,768 706,189 698,841 7,114
Effect of exchange rate changes on cash and
cash equivalents ................................................................................. 25,429 (84,759) (129,793) (1,321)
Net increase (decrease) in cash and cash equivalents ................... 330,992 (271,832) 815,733 8,304
Cash and cash equivalents at beginning of year ............................ 1,569,387 1,900,379 1,628,547 16,579
Cash and cash equivalents at end of year ....................................... ¥ 1,900,379 ¥ 1,628,547 ¥ 2,444,280 $ 24,883
The accompanying notes are an integral part of these consolidated financial statements.
Toyota Motor Corporation
For the years ended March 31, 2007, 2008 and 2009