Toyota 2009 Annual Report Download - page 107
Download and view the complete annual report
Please find page 107 of the 2009 Toyota annual report below. You can navigate through the pages in the report by either clicking on the pages listed below, or by using the keyword search tool below to find specific information within the annual report.-
 1
1 -
2
-
3
-
4
-
5
-
6
-
7
-
8
-
9
-
10
-
11
-
12
-
13
-
14
-
15
-
16
-
17
-
18
-
19
-
20
-
21
-
22
-
23
-
24
-
25
-
26
-
27
-
28
-
29
-
30
-
31
-
32
-
33
-
34
-
35
-
36
-
37
-
38
-
39
-
40
-
41
-
42
-
43
-
44
-
45
-
46
-
47
-
48
-
49
-
50
-
51
-
52
-
53
-
54
-
55
-
56
-
57
-
58
-
59
-
60
-
61
-
62
-
63
-
64
-
65
-
66
-
67
-
68
-
69
-
70
-
71
-
72
-
73
-
74
-
75
-
76
-
77
-
78
-
79
-
80
-
81
-
82
-
83
-
84
-
85
-
86
-
87
-
88
-
89
-
90
-
91
-
92
-
93
-
94
-
95
-
96
-
 97
97 -
 98
98 -
 99
99 -
 100
100 -
 101
101 -
 102
102 -
 103
103 -
 104
104 -
 105
105 -
 106
106 -
 107
107 -
 108
108 -
 109
109 -
 110
110 -
 111
111 -
 112
112
 |
 |

The Right Way Forward Business OverviewPerformance Overview Financial Section
Investor
Information
Management &
Corporate Information
Top Messages
Annual Report 2009 105
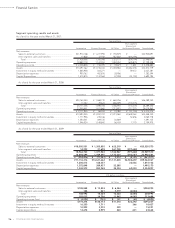
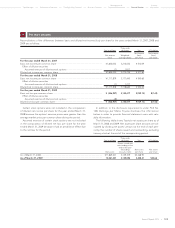
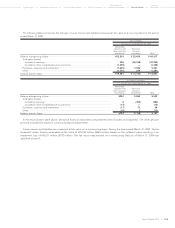
The following table summarizes the changes in Level 3 assets and liabilities measured at fair value on a recurring basis for the period
ended March 31, 2009:
Yen in millions
For the year ended March 31, 2009
Marketable
securities and Derivative
other securities financial
investments instruments Total
Balance at beginning of year ............................................................................................................. ¥23,818 ¥ 25,499 ¥ 49,317
Total gains (losses)
Included in earnings ................................................................................................................... 586 (38,538) (37,952)
Included in other comprehensive income (loss) ....................................................................... (1,398) — (1,398)
Purchases, issuances and settlements .......................................................................................... (1,665) 7,026 5,361
Other ................................................................................................................................................ (1,760) 279 (1,481)
Balance at end of year ........................................................................................................................ ¥19,581 ¥ (5,734) ¥ 13,847
U.S. dollars in millions
For the year ended March 31, 2009
Marketable
securities and Derivative
other securities financial
investments instruments Total
Balance at beginning of year ............................................................................................................. $242 $ 260 $ 502
Total gains (losses)
Included in earnings ................................................................................................................... 6 (392) (386)
Included in other comprehensive income (loss) ....................................................................... (14) — (14)
Purchases, issuances and settlements .......................................................................................... (17) 71 54
Other ................................................................................................................................................ (18) 3 (15)
Balance at end of year ........................................................................................................................ $199 $ (58) $ 141
In the reconciliation table above, derivative financial instruments are presented net of assets and (liabilities). The other amount
primarily includes the impact of currency translation adjustments.
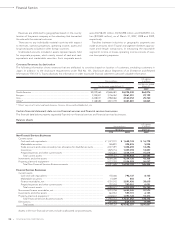
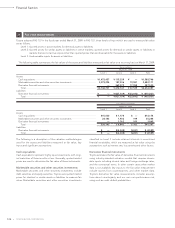
Certain assets and liabilities are measured at fair value on a nonrecurring basis. During the year ended March 31, 2009, Toyota
measured certain finance receivables at fair value of ¥25,932 million ($264 million) based on the collateral value, resulting in an
impairment loss of ¥10,011 million ($102 million). This fair value measurement on a nonrecurring basis as of March 31, 2009 was
classified as level 3.