Toyota 2009 Annual Report Download - page 76
Download and view the complete annual report
Please find page 76 of the 2009 Toyota annual report below. You can navigate through the pages in the report by either clicking on the pages listed below, or by using the keyword search tool below to find specific information within the annual report.-
 1
1 -
2
-
3
-
4
-
5
-
6
-
7
-
8
-
9
-
10
-
11
-
12
-
13
-
14
-
15
-
16
-
17
-
18
-
19
-
20
-
21
-
22
-
23
-
24
-
25
-
26
-
27
-
28
-
29
-
30
-
31
-
32
-
33
-
34
-
35
-
36
-
37
-
38
-
39
-
40
-
41
-
42
-
43
-
44
-
45
-
46
-
47
-
48
-
49
-
50
-
51
-
52
-
53
-
54
-
55
-
56
-
57
-
58
-
59
-
60
-
61
-
62
-
63
-
64
-
65
-
 66
66 -
 67
67 -
 68
68 -
 69
69 -
 70
70 -
 71
71 -
 72
72 -
 73
73 -
 74
74 -
 75
75 -
 76
76 -
 77
77 -
 78
78 -
 79
79 -
 80
80 -
 81
81 -
 82
82 -
 83
83 -
 84
84 -
 85
85 -
 86
86 -
87
-
88
-
89
-
90
-
91
-
92
-
93
-
94
-
95
-
96
-
97
-
98
-
99
-
100
-
101
-
102
-
103
-
104
-
105
-
106
-
107
-
108
-
109
-
110
-
111
-
112
 |
 |
Financial Section
TOYOTA MOTOR CORPORATION
74
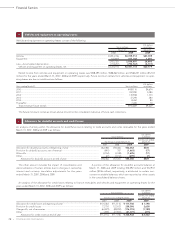
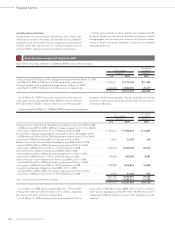
Marketable securities and other securities investments include debt and equity securities for which the aggregate cost, gross unrealized
gains and losses and fair value are as follows:
Yen in millions
March 31, 2008
Gross Gross
unrealized unrealized Fair
Cost gains losses value
Available-for-sale
Debt securities ............................................................................................................ ¥2,602,951 ¥ 52,345 ¥ 4,673 ¥2,650,623
Equity securities .......................................................................................................... 853,174 342,596 18,681 1,177,089
Total .......................................................................................................................... ¥3,456,125 ¥394,941 ¥23,354 ¥3,827,712
Securities not practicable to determine fair value
Debt securities ............................................................................................................ ¥ 30,239
Equity securities .......................................................................................................... 113,497
Total .......................................................................................................................... ¥143,736
Yen in millions
March 31, 2009
Gross Gross
unrealized unrealized Fair
Cost gains losses value
Available-for-sale
Debt securities ............................................................................................................ ¥1,704,904 ¥ 42,326 ¥ 65,379 ¥1,681,851
Equity securities .......................................................................................................... 736,966 172,992 111,698 798,260
Total .......................................................................................................................... ¥2,441,870 ¥215,318 ¥177,077 ¥2,480,111
Securities not practicable to determine fair value
Debt securities ............................................................................................................ ¥ 26,104
Equity securities .......................................................................................................... 91,985
Total .......................................................................................................................... ¥118,089
U.S. dollars in millions
March 31, 2009
Gross Gross
unrealized unrealized Fair
Cost gains losses value
Available-for-sale
Debt securities ............................................................................................................ $17,357 $ 431 $ 666 $17,122
Equity securities .......................................................................................................... 7,502 1,761 1,137 8,126
Total .......................................................................................................................... $24,859 $2,192 $1,803 $25,248
Securities not practicable to determine fair value
Debt securities ............................................................................................................ $ 266
Equity securities .......................................................................................................... 937
Total .......................................................................................................................... $1,203
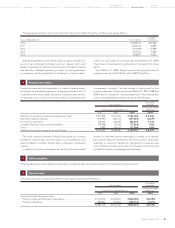
Unrealized losses continuing over a 12 month period or more
in the aggregate were not material at March 31, 2008 and 2009.
At March 31, 2008 and 2009, debt securities classified as avail-
able-for-sale mainly consist of government bonds and corporate
debt securities with maturities from 1 to 10 years.
Proceeds from sales of available-for-sale securities were
¥148,442 million, ¥165,495 million and ¥800,422 million ($8,148
million) for the years ended March 31, 2007, 2008 and 2009,
respectively. On those sales, gross realized gains were ¥8,832
million, ¥18,766 million and ¥35,694 million ($363 million) and
gross realized losses were ¥317 million, ¥21 million and ¥1,856
million ($19 million), respectively.
During the years ended March 31, 2007, 2008 and 2009, Toyota
recognized impairment losses on available-for-sale securities of
¥4,614 million, ¥11,346 million, and ¥220,920 million ($2,249 mil-
lion), respectively, which are included in “Other income (loss),
net” in the accompanying consolidated statements of income.
Impairment losses recognized during the year ended March
Marketable securities and other securities investments:
6