Toyota 2009 Annual Report Download - page 104
Download and view the complete annual report
Please find page 104 of the 2009 Toyota annual report below. You can navigate through the pages in the report by either clicking on the pages listed below, or by using the keyword search tool below to find specific information within the annual report.-
 1
1 -
2
-
3
-
4
-
5
-
6
-
7
-
8
-
9
-
10
-
11
-
12
-
13
-
14
-
15
-
16
-
17
-
18
-
19
-
20
-
21
-
22
-
23
-
24
-
25
-
26
-
27
-
28
-
29
-
30
-
31
-
32
-
33
-
34
-
35
-
36
-
37
-
38
-
39
-
40
-
41
-
42
-
43
-
44
-
45
-
46
-
47
-
48
-
49
-
50
-
51
-
52
-
53
-
54
-
55
-
56
-
57
-
58
-
59
-
60
-
61
-
62
-
63
-
64
-
65
-
66
-
67
-
68
-
69
-
70
-
71
-
72
-
73
-
74
-
75
-
76
-
77
-
78
-
79
-
80
-
81
-
82
-
83
-
84
-
85
-
86
-
87
-
88
-
89
-
90
-
91
-
92
-
93
-
 94
94 -
 95
95 -
 96
96 -
 97
97 -
 98
98 -
 99
99 -
 100
100 -
 101
101 -
 102
102 -
 103
103 -
 104
104 -
 105
105 -
 106
106 -
 107
107 -
 108
108 -
 109
109 -
 110
110 -
 111
111 -
 112
112
 |
 |

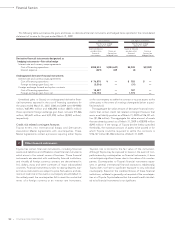
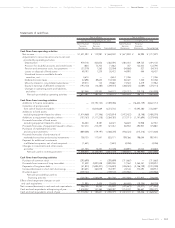
Financial Section
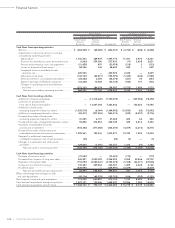
TOYOTA MOTOR CORPORATION
102
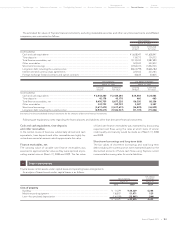
Yen in millions U.S. dollars in millions
For the year ended March 31, 2009 For the year ended March 31, 2009
Non-Financial Financial Non-Financial Financial
Services Services Services Services
Businesses Businesses Consolidated Businesses Businesses Consolidated
Cash flows from operating activities
Net loss .............................................................................. ¥ (368,569) ¥ (68,388) ¥ (436,937) $ (3,752) $ (696) $ (4,448)
Adjustments to reconcile net loss to net cash
provided by operating activities
Depreciation .................................................................. 1,105,233 389,937 1,495,170 11,251 3,970 15,221
Provision for doubtful accounts and credit losses ..... (1,663) 259,096 257,433 (17) 2,638 2,621
Pension and severance costs, less payments ............. (21,428) 470 (20,958) (218) 5 (213)
Losses on disposal of fixed assets ............................... 68,546 136 68,682 698 1 699
Unrealized losses on available-for-sale
securities, net .............................................................. 220,920 — 220,920 2,249 — 2,249
Deferred income taxes ................................................. (132,127) (62,871) (194,990) (1,345) (640) (1,985)
Minority interest in consolidated subsidiaries ............ (26,282) 2,004 (24,278) (267) 20 (247)
Equity in earnings of affiliated companies .................. (53,226) 10,502 (42,724) (542) 107 (435)
Changes in operating assets and liabilities,
and other ..................................................................... (223,101) 186,234 154,587 (2,272) 1,895 1,573
Net cash provided by operating activities .............. 568,303 717,120 1,476,905 5,785 7,300 15,035
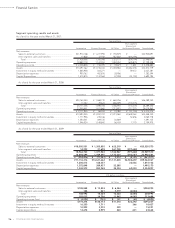
Cash flows from investing activities
Additions to finance receivables ..................................... — (13,318,620) (7,700,459) — (135,586) (78,392)
Collection of and proceeds
from sale of finance receivables .................................... — 13,047,393 7,243,442 — 132,825 73,740
Additions to fixed assets
excluding equipment leased to others ......................... (1,358,518) (6,064) (1,364,582) (13,830) (62) (13,892)
Additions to equipment leased to others ...................... (82,411) (877,904) (960,315) (839) (8,937) (9,776)
Proceeds from sales of fixed assets
excluding equipment leased to others ......................... 41,285 6,101 47,386 420 62 482
Proceeds from sales of equipment leased to others ..... 55,896 472,853 528,749 569 4,814 5,383
Purchases of marketable securities
and security investments ................................................ (418,342) (217,688) (636,030) (4,259) (2,216) (6,475)
Proceeds from sales of and maturity of
marketable securities and security investments ........... 1,295,561 180,316 1,475,877 13,189 1,835 15,024
Payment for additional investments
in affiliated companies, net of cash acquired ............... (45) — (45) (0) — (0)
Changes in investments and other assets,
and other ......................................................................... 129,834 (2,091) 135,757 1,322 (21) 1,382
Net cash used in investing activities ........................ (336,740) (715,704) (1,230,220) (3,428) (7,286) (12,524)
Cash flows from financing activities
Purchase of common stock .............................................. (70,587) — (70,587) (719) — (719)
Proceeds from issuance of long-term debt .................... 545,981 3,030,029 3,506,990 5,558 30,846 35,702
Payments of long-term debt ............................................ (150,097) (2,580,637) (2,704,078) (1,528) (26,271) (27,528)
Increase in short-term borrowings .................................. 138,387 239,462 406,507 1,409 2,438 4,138
Dividends paid .................................................................. (439,991) — (439,991) (4,479) — (4,479)
Net cash provided by financing activities ............... 23,693 688,854 698,841 241 7,013 7,114
Effect of exchange rate changes on cash
and cash equivalents .......................................................... (80,214) (49,579) (129,793) (816) (505) (1,321)
Net increase in cash and cash equivalents ......................... 175,042 640,691 815,733 1,782 6,522 8,304
Cash and cash equivalents at beginning of year ............... 1,473,101 155,446 1,628,547 14,996 1,583 16,579
Cash and cash equivalents at end of year .......................... ¥ 1,648,143 ¥ 796,137 ¥ 2,444,280 $ 16,778 $ 8,105 $ 24,883