Toyota 2009 Annual Report Download - page 64
Download and view the complete annual report
Please find page 64 of the 2009 Toyota annual report below. You can navigate through the pages in the report by either clicking on the pages listed below, or by using the keyword search tool below to find specific information within the annual report.-
 1
1 -
2
-
3
-
4
-
5
-
6
-
7
-
8
-
9
-
10
-
11
-
12
-
13
-
14
-
15
-
16
-
17
-
18
-
19
-
20
-
21
-
22
-
23
-
24
-
25
-
26
-
27
-
28
-
29
-
30
-
31
-
32
-
33
-
34
-
35
-
36
-
37
-
38
-
39
-
40
-
41
-
42
-
43
-
44
-
45
-
46
-
47
-
48
-
49
-
50
-
51
-
52
-
53
-
 54
54 -
 55
55 -
 56
56 -
 57
57 -
 58
58 -
 59
59 -
 60
60 -
 61
61 -
 62
62 -
 63
63 -
 64
64 -
 65
65 -
 66
66 -
 67
67 -
 68
68 -
 69
69 -
 70
70 -
 71
71 -
 72
72 -
 73
73 -
 74
74 -
75
-
76
-
77
-
78
-
79
-
80
-
81
-
82
-
83
-
84
-
85
-
86
-
87
-
88
-
89
-
90
-
91
-
92
-
93
-
94
-
95
-
96
-
97
-
98
-
99
-
100
-
101
-
102
-
103
-
104
-
105
-
106
-
107
-
108
-
109
-
110
-
111
-
112
 |
 |

Financial Section
TOYOTA MOTOR CORPORATION
62
sidering several applicable factors including, the composition of
plan assets held, assumed risks of asset management, historical
results of the returns on plan assets, Toyota’s principal policy for
plan asset management, and forecasted market conditions. A
weighted-average discount rate of 2.8% and a weighted-aver-
age expected rate of return on plan assets of 3.6% are the
results of assumptions used for the various pension plans in cal-
culating Toyota’s consolidated pension costs for fiscal 2009.
Also, a weighted-average discount rate of 2.8% is the result of
assumption used for the various pension plans in calculating
Toyota’s consolidated pension obligations for fiscal 2009.
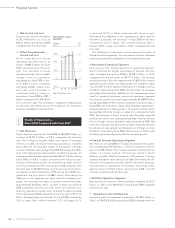
• Sensitivity Analysis
The following table illustrates the effects of assumed changes in
weighted-average discount rate and the weighted-average
expected rate of return on plan assets, which we believe are
critical estimates in determining pension costs and obligations,
assuming all other assumptions are consistent.
Yen in millions
Effect on pre-tax income
for the year ending Effect on PBO
March 31, 2010 as of March 31, 2009
Discount rates
0.5% decrease ............ ¥(10,749) ¥120,771
0.5% increase.............. 10,197 (111,712)
Expected rate of return
on plan assets
0.5% decrease ............ ¥(4,895)
0.5% increase.............. 4,895
Derivatives and Other Contracts at Fair Value
Toyota uses derivatives in the normal course of business to man-
age its exposure to foreign currency exchange rates and interest
rates. The accounting is complex and continues to evolve. In
addition, there are significant judgments and estimates involved
in the estimating of fair value in the absence of quoted market
values. These estimates are based upon valuation methodolo-
gies deemed appropriate under the circumstances. However,
the use of different assumptions may have a material effect on
the estimated fair value amounts.
Marketable Securities and Investments in Affi liated
Companies
Toyota’s accounting policy is to record a write-down of such
investments to net realizable value when a decline in fair value
below the carrying value is other-than-temporary. In determining
if a decline in value is other-than-temporary, Toyota considers
the length of time and the extent to which the fair value has
been less than the carrying value, the financial condition and
prospects of the company and Toyota’s ability and intent to
retain its investment in the company for a period of time suffi-
cient to allow for any anticipated recovery in fair value.
Market Risk Disclosures
Toyota is exposed to market risk from changes in foreign curren-
cy exchange rates, interest rates, certain commodity and equity
security prices. In order to manage the risk arising from changes
in foreign currency exchange rates and interest rates, Toyota
enters into a variety of derivative financial instruments.
A description of Toyota’s accounting policies for derivative
instruments is included in note 2 to the consolidated financial
statements and further disclosure is provided in notes 20 and 21
to the consolidated financial statements.
Toyota monitors and manages these financial exposures as an
integral part of its overall risk management program, which rec-
ognizes the unpredictability of financial markets and seeks to
reduce the potentially adverse effects on Toyota’s operating
results.
The financial instruments included in the market risk analysis
consist of all of Toyota’s cash and cash equivalents, marketable
securities, finance receivables, securities investments, long-term
and short-term debt and all derivative financial instruments.
Toyota’s portfolio of derivative financial instruments consists of
forward foreign currency exchange contracts, foreign currency
options, interest rate swaps, interest rate currency swap agree-
ments and interest rate options. Anticipated transactions
denominated in foreign currencies that are covered by Toyota’s
derivative hedging are not included in the market risk analysis.
Although operating leases are not required to be included,
Toyota has included these instruments in determining interest
rate risk.
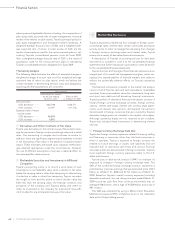
Foreign Currency Exchange Rate Risk
Toyota has foreign currency exposures related to buying, selling
and financing in currencies other than the local currencies in
which it operates. Toyota is exposed to foreign currency risk
related to future earnings or assets and liabilities that are
exposed due to operating cash flows and various financial
instruments that are denominated in foreign currencies. Toyota’s
most significant foreign currency exposures relate to the U.S.
dollar and the euro.
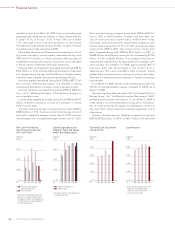
Toyota uses a value-at-risk analysis (“VAR”) to evaluate its
exposure to changes in foreign currency exchange rates. The
VAR of the combined foreign exchange position represents a
potential loss in pre-tax earnings that was estimated to be ¥44.3
billion as of March 31, 2008 and ¥114.1 billion as of March 31,
2009. Based on Toyota's overall currency exposure (including
derivative positions), the risk during the year ended March 31,
2009 to pre-tax cash flow from currency movements was on
average ¥126.0 billion, with a high of ¥158.9 billion and a low of
¥97.1 billion.
The VAR was estimated by using a Monte Carlo Simulation
Method and assumed 95% confidence level on the realization
date and a 10-day holding period.