Time Warner Cable 2015 Annual Report Download - page 55
Download and view the complete annual report
Please find page 55 of the 2015 Time Warner Cable annual report below. You can navigate through the pages in the report by either clicking on the pages listed below, or by using the keyword search tool below to find specific information within the annual report.-
 1
1 -
2
-
3
-
4
-
5
-
6
-
7
-
8
-
9
-
10
-
11
-
12
-
13
-
14
-
15
-
16
-
17
-
18
-
19
-
20
-
21
-
22
-
23
-
24
-
25
-
26
-
27
-
28
-
29
-
30
-
31
-
32
-
33
-
34
-
35
-
36
-
37
-
38
-
39
-
40
-
41
-
42
-
43
-
44
-
 45
45 -
 46
46 -
 47
47 -
 48
48 -
 49
49 -
 50
50 -
 51
51 -
 52
52 -
 53
53 -
 54
54 -
 55
55 -
 56
56 -
 57
57 -
 58
58 -
 59
59 -
 60
60 -
 61
61 -
 62
62 -
 63
63 -
 64
64 -
 65
65 -
66
-
67
-
68
-
69
-
70
-
71
-
72
-
73
-
74
-
75
-
76
-
77
-
78
-
79
-
80
-
81
-
82
-
83
-
84
 |
 |

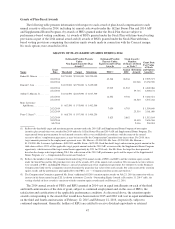
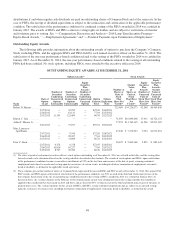
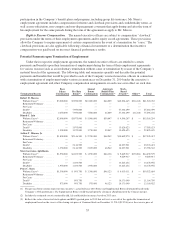
agreement. Mr. Stern received additional retention equity awards in August 2014 to reflect an increase in his target compensation with a
vesting schedule consistent with the retention equity awards made in February 2014. The vesting dates for the unvested RSU and PBU
awards are as follows as of December 31, 2014:
Number of
RSUs
and PBUs
That Have
Not Vested
Date of
Grant Vesting Dates
Robert D. Marcus ........................................ 13,230 2/17/2011 2/17/2015
46,200 2/16/2012 2/16/2015 and 2/16/2016
25,320 2/13/2013 2/13/2016 and 2/13/2017
70,914 2/12/2014 2/12/2017 and 2/12/2018
55,984 2/12/2014 2/12/2018 and 2/12/2019
55,984 2/12/2014 2/12/2019 and 2/12/2020
Dinesh C. Jain. .......................................... 29,858 2/12/2014 2/12/2017 and 2/12/2018
29,858 2/12/2014 2/12/2018 and 2/12/2019
29,858 2/12/2014 2/12/2019 and 2/12/2020
Arthur T. Minson, Jr. ...................................... 19,128 5/31/2013 5/31/2016 and 5/31/2017
24,260 2/12/2014 2/12/2017 and 2/12/2018
24,260 2/12/2014 2/12/2018 and 2/12/2019
24,260 2/12/2014 2/12/2019 and 2/12/2020
Marc Lawrence-Apfelbaum ................................ 3,764 2/17/2011 2/17/2015
8,820 2/16/2012 2/16/2015 and 2/16/2016
6,647 2/13/2013 2/13/2016 and 2/13/2017
11,757 2/12/2014 2/12/2017 and 2/12/2018
11,757 2/12/2014 2/12/2018 and 2/12/2019
11,757 2/12/2014 2/12/2019 and 2/12/2020
Peter C. Stern ............................................ 2,573 2/17/2011 2/17/2015
5,040 2/16/2012 2/16/2015 and 2/16/2016
5,486 2/13/2013 2/13/2016 and 2/13/2017
9,705 2/12/2014 2/12/2017 and 2/12/2018
9,705 2/12/2014 2/12/2018 and 2/12/2019
9,705 2/12/2014 2/12/2019 and 2/12/2020
1,008 8/1/2014 2/12/2018 and 2/12/2019
1,008 8/1/2014 2/12/2019 and 2/12/2020
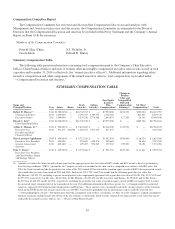
(3) Calculated using the NYSE closing price on December 31, 2014 of $152.06 per share of Common Stock.
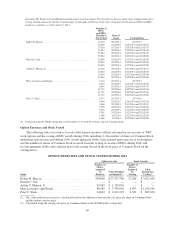
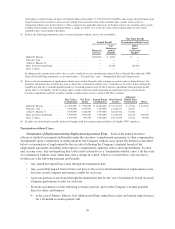
Option Exercises and Stock Vested
The following table sets forth as to each of the named executive officers information on exercises of TWC
stock options and the vesting of RSU awards during 2014, including: (i) the number of shares of Common Stock
underlying options exercised during 2014; (ii) the aggregate dollar value realized upon exercise of such options;
(iii) the number of shares of Common Stock received from the vesting of awards of RSUs during 2014; and
(iv) the aggregate dollar value realized upon such vesting (based on the stock price of Common Stock on the
vesting dates).
OPTION EXERCISES AND STOCK VESTED DURING 2014
Option Awards Stock Awards
Name
Number of
Shares
Acquired
on
Exercise
Value Realized
on Exercise(1)
Number of
Shares
Acquired
on
Vesting
Value
Realized on
Vesting(2)
Robert D. Marcus ................................. 304,000 $ 23,533,740 27,206 $ 3,822,662
Dinesh C. Jain .................................... — $ — — $ —
Arthur T. Minson, Jr. ............................... 25,065 $ 1,328,001 — $ —
Marc Lawrence-Apfelbaum .......................... 80,585 $ 5,769,069 8,497 $ 1,189,956
Peter C. Stern ..................................... 24,663 $ 2,012,207 6,320 $ 882,654
(1) The value realized on exercise is calculated based on the difference between the sale price per share of Common Stock
and the option exercise price.
(2) Calculated using the closing sale price of Common Stock on the NYSE on the vesting date.
49