Time Warner Cable 2015 Annual Report Download - page 47
Download and view the complete annual report
Please find page 47 of the 2015 Time Warner Cable annual report below. You can navigate through the pages in the report by either clicking on the pages listed below, or by using the keyword search tool below to find specific information within the annual report.-
 1
1 -
2
-
3
-
4
-
5
-
6
-
7
-
8
-
9
-
10
-
11
-
12
-
13
-
14
-
15
-
16
-
17
-
18
-
19
-
20
-
21
-
22
-
23
-
24
-
25
-
26
-
27
-
28
-
29
-
30
-
31
-
32
-
33
-
34
-
35
-
36
-
 37
37 -
 38
38 -
 39
39 -
 40
40 -
 41
41 -
 42
42 -
 43
43 -
 44
44 -
 45
45 -
 46
46 -
 47
47 -
 48
48 -
 49
49 -
 50
50 -
 51
51 -
 52
52 -
 53
53 -
 54
54 -
 55
55 -
 56
56 -
 57
57 -
58
-
59
-
60
-
61
-
62
-
63
-
64
-
65
-
66
-
67
-
68
-
69
-
70
-
71
-
72
-
73
-
74
-
75
-
76
-
77
-
78
-
79
-
80
-
81
-
82
-
83
-
84
 |
 |

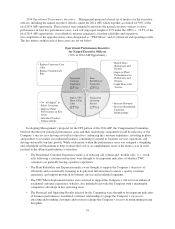
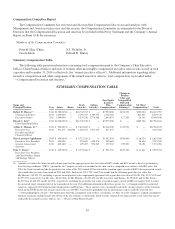
when appropriate. In connection with ClearBridge’s role as advisor to the Compensation Committee,
Management from time to time seeks input from ClearBridge about compensation proposals it is considering for
presentation to the Compensation Committee. ClearBridge does not provide services to the Company other than
under its engagement by the Compensation Committee related to executive compensation or in connection with
the review of non-employee director compensation.
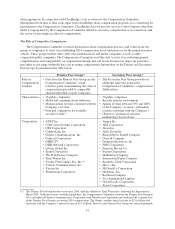
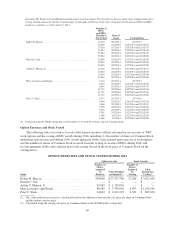
The Role of Competitive Comparisons
The Compensation Committee reviewed information about compensation practices and values from two
groups of companies to assist it in establishing 2014 compensation levels and practices for the named executive
officers. These groups include other cable, telecommunications and media companies as well as other
comparable public companies. The Compensation Committee used this data to assist it in evaluating general
competitiveness and comparability of compensation design, mix and levels but does not target any particular
percentile or pay range within the data sets in setting compensation. Information on the Primary and Secondary
Peer Groups is presented in the table below.
Primary Peer Group(1) Secondary Peer Group(2)
Role in
Compensation
Analysis
• Data from the Primary Peer Group are the
Compensation Committee’s main
reference point in determining the value of
compensation provided to comparably
situated individuals at peer companies
• The Secondary Peer Group provides an
additional reference point in the
Compensation Committee’s compensation
deliberations
Characteristics • 16 public companies • 20 public companies
• Media and communications industries • Broader industry environment
• Median annual revenue consistent with the
Company’s revenue
• Annual revenue between 50% and 200%
of the Company’s revenue, and median
• Principal competitors for available
executive talent(3)
revenue consistent with the Company’s
• Objective, mechanical selection
methodology based on size
Composition • AT&T Inc. • Amgen Inc.
• Cablevision Systems Corporation • AES Corporation
• CBS Corporation • Alcoa Inc.
• CenturyLink, Inc. • Altria Group Inc.
• Charter Communications, Inc. • Bristol-Myers Squibb Company
• Comcast Corporation • Deere & Company
• DIRECTV • Dominion Resources, Inc.
• DISH Network Corporation • EMC Corporation
• Liberty Global Inc. • Emerson Electric Co.
• Sprint Corporation • Exelon Corporation
• The Walt Disney Company • Halliburton Company
• Time Warner Inc. • International Paper Company
• Twenty First Century Fox, Inc.(4) • Kimberly-Clark Corporation
• Verizon Communications, Inc. • Macy’s Inc.
• Viacom Inc. • McDonald’s Corporation
• Windstream Corporation • Medtronic, Inc.
• Raytheon Company
• Tyco International Limited
• Union Pacific Corporation
• Xerox Corporation
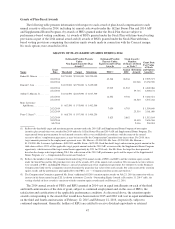
(1) This Primary Peer Group has been used since 2009, with the addition of Time Warner Inc. following the Separation in
March 2009. Under previously established guidelines, the Compensation Committee reviewed the Primary Peer Group in
2013 and replaced Frontier Communications Corporation with Windstream Corporation and confirmed the continued use
of this Primary Peer Group in reviewing 2014 compensation. The Group’s median annual revenue of $23.6 billion was
consistent with the Company’s annual revenue of $21.4 billion. However, the Primary Peer Group was selected primarily
41