Time Warner Cable 2015 Annual Report Download - page 51
Download and view the complete annual report
Please find page 51 of the 2015 Time Warner Cable annual report below. You can navigate through the pages in the report by either clicking on the pages listed below, or by using the keyword search tool below to find specific information within the annual report.-
 1
1 -
2
-
3
-
4
-
5
-
6
-
7
-
8
-
9
-
10
-
11
-
12
-
13
-
14
-
15
-
16
-
17
-
18
-
19
-
20
-
21
-
22
-
23
-
24
-
25
-
26
-
27
-
28
-
29
-
30
-
31
-
32
-
33
-
34
-
35
-
36
-
37
-
38
-
39
-
40
-
 41
41 -
 42
42 -
 43
43 -
 44
44 -
 45
45 -
 46
46 -
 47
47 -
 48
48 -
 49
49 -
 50
50 -
 51
51 -
 52
52 -
 53
53 -
 54
54 -
 55
55 -
 56
56 -
 57
57 -
 58
58 -
 59
59 -
 60
60 -
 61
61 -
62
-
63
-
64
-
65
-
66
-
67
-
68
-
69
-
70
-
71
-
72
-
73
-
74
-
75
-
76
-
77
-
78
-
79
-
80
-
81
-
82
-
83
-
84
 |
 |

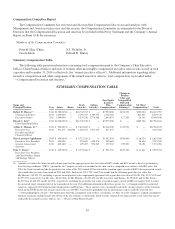
Compensation Committee Report
The Compensation Committee has reviewed and discussed the Compensation Discussion and Analysis with
Management and, based on such review and discussions, the Compensation Committee recommended to the Board of
Directors that the Compensation Discussion and Analysis be included in this Proxy Statement and the Company’s Annual
Report on Form 10-K (by reference).
Members of the Compensation Committee
Peter R. Haje (Chair) N.J. Nicholas, Jr.
Carole Black Edward D. Shirley
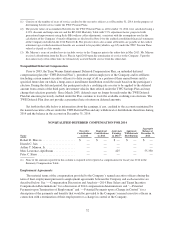
Summary Compensation Table
The following table presents information concerning total compensation paid to the Company’s Chief Executive
Officer, Chief Financial Officer and each of its three other most highly compensated executive officers who served in such
capacities on December 31, 2014 (collectively, the “named executive officers”). Additional information regarding salary,
incentive compensation and other components of the named executive officers’ total compensation is provided under
“—Compensation Discussion and Analysis.”
SUMMARY COMPENSATION TABLE
Name and
Principal Position Year Salary Bonus
Stock
Awards(1)
Option
Awards(2)
Non-Equity
Incentive
Plan
Compensation(3)
Change in
Pension
Value and
Nonqualified
Deferred
Compensation
Earnings(4)
All Other
Compensation(5) Total
Robert D. Marcus(6) ............ 2014 $1,500,000 $ — $24,745,763 $ — $7,950,000 $134,330 $285,504 $34,615,597
Chairman and Chief 2013 1,000,000 — 2,196,763 2,489,576 2,726,250 — 106,565 8,519,154
Executive Officer 2012 1,000,000 — 3,559,248 2,734,098 2,646,875 127,320 28,105 10,095,646
Dinesh C. Jain(7) ............... 2014 $1,000,000 $ — $12,120,258 $ — $3,975,000 $ — $889,106 $17,984,364
Chief Operating Officer
Arthur T. Minson, Jr.(8) ......... 2014 $ 900,000 $ — $ 9,847,863 $ — $2,146,500 $ 89,970 $ — $12,984,333
Executive Vice
President and Chief
Financial Officer
2013 574,615 500,000 1,826,915 1,767,619 817,875 — — 5,487,024
Marc Lawrence-Apfelbaum ..... 2014 $ 650,000 $ — $ 4,772,520 $ — $1,033,500 $330,900 $ 28,136 $ 6,815,056
Executive Vice President, 2013 650,000 — 576,694 659,476 590,688 — 38,648 2,515,506
General Counsel and
Secretary
2012 645,400 — 679,493 956,945 679,365 239,500 50,391 3,251,094
Peter C. Stern(9) ............... 2014 $ 625,000 $ — $ 4,233,646 $ — $ 993,750 $129,720 $ 11,667 $ 5,993,783
Executive Vice President
and Chief Product, People
and Strategy Officer
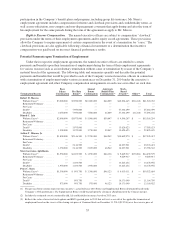
(1) Amounts set forth in the Stock Awards column represent the aggregate grant date fair value of RSU awards and RSU awards subject to performance-
based vesting conditions (“PBUs”) granted by the Company in each year included in the table, each as computed in accordance with SEC rules. For
2014, the Stock Awards include the grant date fair value of the 2014 annual LTI award and the retention equity awards of RSUs that represented awards
that would otherwise have been made in 2015 and 2016. Each of the 2014, 2015 and 2016 awards had the following grant date fair value: For
Mr. Marcus—$9,595,373 (including a special award pursuant to his employment agreement with a grant date fair value of $2,020,178), $7,575,195 and
$7,575,195, respectively; for Mr. Jain—$4,040,086; for Mr. Minson—$3,282,621; for Mr. Lawrence-Apfelbaum—$1,590,840; and for Mr. Stern—
$1,313,184, $1,460,231 and $1,460,231, respectively, including the grant date fair value of retention equity awards of RSUs in August 2014 to reflect
his increased target compensation for the remainder of the year. For additional information about these grants, see “—Compensation Discussion and
Analysis—Special 2014 Compensation Considerations and Programs.” These amounts were calculated based on the closing sale price of the Common
Stock on the NYSE on the date of grant and, in the case of PBUs, based on the probability that the performance targets would be achieved. See
“—Outstanding Equity Awards.” For information about the assumptions used in these calculations, see Note 13 to the Company’s audited consolidated
financial statements included in the 2014 Form 10-K. The amounts set forth in the Stock Awards column do not represent the actual value that may be
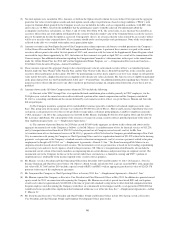
realized by the named executive officers. See “—Grants of Plan-Based Awards.”
45