Time Magazine 2012 Annual Report Download - page 95
Download and view the complete annual report
Please find page 95 of the 2012 Time Magazine annual report below. You can navigate through the pages in the report by either clicking on the pages listed below, or by using the keyword search tool below to find specific information within the annual report.-
 1
1 -
2
-
3
-
4
-
5
-
6
-
7
-
8
-
9
-
10
-
11
-
12
-
13
-
14
-
15
-
16
-
17
-
18
-
19
-
20
-
21
-
22
-
23
-
24
-
25
-
26
-
27
-
28
-
29
-
30
-
31
-
32
-
33
-
34
-
35
-
36
-
37
-
38
-
39
-
40
-
41
-
42
-
43
-
44
-
45
-
46
-
47
-
48
-
49
-
50
-
51
-
52
-
53
-
54
-
55
-
56
-
57
-
58
-
59
-
60
-
61
-
62
-
63
-
64
-
65
-
66
-
67
-
68
-
69
-
70
-
71
-
72
-
73
-
74
-
75
-
76
-
77
-
78
-
79
-
80
-
81
-
82
-
83
-
84
-
 85
85 -
 86
86 -
 87
87 -
 88
88 -
 89
89 -
 90
90 -
 91
91 -
 92
92 -
 93
93 -
 94
94 -
 95
95 -
 96
96 -
 97
97 -
 98
98 -
 99
99 -
 100
100 -
 101
101 -
 102
102 -
 103
103 -
 104
104 -
 105
105 -
106
-
107
-
108
-
109
-
110
-
111
-
112
-
113
-
114
-
115
-
116
-
117
-
118
-
119
-
120
-
121
-
122
-
123
-
124
-
125
-
126
-
127
-
128
-
129
-
130
-
131
-
132
-
133
-
134
 |
 |

TIME WARNER INC.
NOTES TO CONSOLIDATED FINANCIAL STATEMENTS – (Continued)
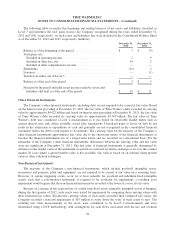
disposition of the assets. Nonrecurring fair value measurements made in connection with the Company’s decision
to shut down Turner’s TNT television operations in Turkey during the second quarter of 2012 were not
significant.
In determining the fair value of its theatrical films, the Company employs a DCF methodology that includes
cash flow estimates of a film’s ultimate revenue and costs as well as a discount rate. The discount rate utilized in
the DCF analysis is based on the weighted average cost of capital of the respective business (e.g., Warner Bros.)
plus a risk premium representing the risk associated with producing a particular theatrical film. The fair value of
any theatrical film and television production that management plans to abandon is zero. As the primary
determination of fair value is determined using a DCF model, the resulting fair value is considered a Level 3
measurement. During the year ended December 31, 2012, certain theatrical film and television production costs,
which were recorded as inventory in the Consolidated Balance Sheet, were written down to $257 million from
their carrying value of $414 million. During the year ended December 31, 2011, certain theatrical film and
television production costs, which were recorded as inventory in the Consolidated Balance Sheet, were written
down to $400 million from their carrying value of $511 million.
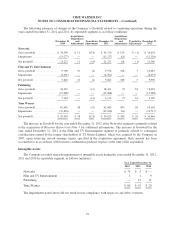
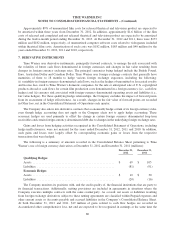
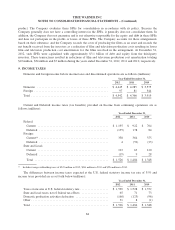
6. INVENTORIES AND THEATRICAL FILM AND TELEVISION PRODUCTION COSTS
Inventories and theatrical film and television production costs consist of (millions):
December 31,
2012
December 31,
2011
Inventories:
Programming costs, less amortization ............................. $ 3,951 $ 3,321
DVDs, Blu-ray Discs, books, paper and other merchandise ............ 326 340
Total inventories ............................................. 4,277 3,661
Less: current portion of inventory ................................ (2,060) (1,890)
Total noncurrent inventories .................................... 2,217 1,771
Theatrical film production costs:(a)
Released, less amortization ..................................... 597 844
Completed and not released ..................................... 174 295
In production ................................................ 1,770 1,592
Development and pre-production ................................ 106 87
Television production costs:(a)
Released, less amortization ..................................... 1,034 1,141
Completed and not released ..................................... 396 360
In production ................................................ 487 499
Development and pre-production ................................ 4 5
Total theatrical film and television production costs ................. 4,568 4,823
Total noncurrent inventories and theatrical film and television production
costs ..................................................... $ 6,785 $ 6,594
(a) Does not include $1.107 billion and $1.320 billion of acquired film library intangible assets as of December 31, 2012 and December 31,
2011, respectively, which are included in Intangible assets subject to amortization in the Consolidated Balance Sheet.
79