Time Magazine 2012 Annual Report Download - page 54
Download and view the complete annual report
Please find page 54 of the 2012 Time Magazine annual report below. You can navigate through the pages in the report by either clicking on the pages listed below, or by using the keyword search tool below to find specific information within the annual report.-
 1
1 -
2
-
3
-
4
-
5
-
6
-
7
-
8
-
9
-
10
-
11
-
12
-
13
-
14
-
15
-
16
-
17
-
18
-
19
-
20
-
21
-
22
-
23
-
24
-
25
-
26
-
27
-
28
-
29
-
30
-
31
-
32
-
33
-
34
-
35
-
36
-
37
-
38
-
39
-
40
-
41
-
42
-
43
-
 44
44 -
 45
45 -
 46
46 -
 47
47 -
 48
48 -
 49
49 -
 50
50 -
 51
51 -
 52
52 -
 53
53 -
 54
54 -
 55
55 -
 56
56 -
 57
57 -
 58
58 -
 59
59 -
 60
60 -
 61
61 -
 62
62 -
 63
63 -
 64
64 -
65
-
66
-
67
-
68
-
69
-
70
-
71
-
72
-
73
-
74
-
75
-
76
-
77
-
78
-
79
-
80
-
81
-
82
-
83
-
84
-
85
-
86
-
87
-
88
-
89
-
90
-
91
-
92
-
93
-
94
-
95
-
96
-
97
-
98
-
99
-
100
-
101
-
102
-
103
-
104
-
105
-
106
-
107
-
108
-
109
-
110
-
111
-
112
-
113
-
114
-
115
-
116
-
117
-
118
-
119
-
120
-
121
-
122
-
123
-
124
-
125
-
126
-
127
-
128
-
129
-
130
-
131
-
132
-
133
-
134
 |
 |
TIME WARNER INC.
MANAGEMENT’S DISCUSSION AND ANALYSIS
OF RESULTS OF OPERATIONS AND FINANCIAL CONDITION – (Continued)
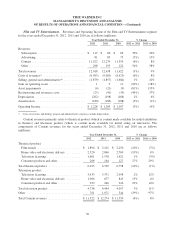
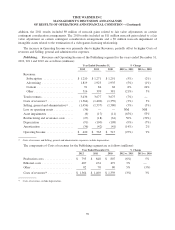
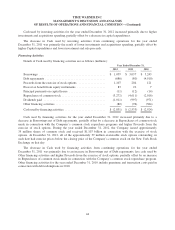
Theatrical film valuation adjustments for the years ended December 31, 2012 and 2011 were $92 million and $74
million, respectively. Other costs, including merchandise and related costs, decreased for the year ended
December 31, 2012 primarily due to lower distribution costs, associated with lower theatrical home video and
videogame sales.
As previously noted under “Transactions and Other Items Affecting Comparability,” the 2012 results
included $4 million of noncash impairments. The 2011 results included $21 million of noncash impairments, of
which $12 million related to capitalized software costs. In addition, the 2011 results included $9 million of
noncash gains related to fair value adjustments on certain contingent consideration arrangements.
The decrease in Operating Income for the year ended December 31, 2012 was primarily due to lower
Revenues, partially offset by lower Costs of revenues.
2011 vs. 2010
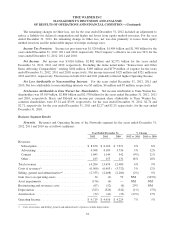
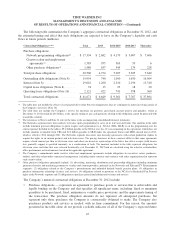
The increase in Content revenues for the year ended December 31, 2011 included the net positive impact of
foreign exchange rates of approximately $215 million.
Theatrical product revenues from film rentals decreased due primarily to lower carryover revenues from
prior period releases. There were 22 theatrical films released in 2011 as compared to 23 in 2010.
Theatrical product revenues from home video and electronic delivery increased due to higher carryover
revenues from prior period releases and catalog revenues of $78 million and higher revenues from releases in
2011 of $28 million. There were 20 home video and electronic delivery releases in 2011 as compared to 29 in
2010.
Theatrical product revenues from television licensing decreased due primarily to the quantity and mix of
availabilities.
The increase in television product licensing fees was primarily due to higher revenues from worldwide
syndication.
Television product revenues from home video and electronic delivery increased due to higher electronic
delivery revenues of $115 million primarily related to the recognition of revenue associated with a licensing
agreement with Netflix, Inc. (“Netflix”) that allows Netflix’s U.S. members to stream previous seasons of the
scripted series that aired on The CW Network beginning in fall 2011, as well as previous seasons of new scripted
series produced by Warner Bros. or CBS Corporation that premiere on the network through the 2014-2015
broadcast season, partially offset by lower revenues from consumer packaged goods of $81 million.
Other content revenues increased primarily due to higher revenues from videogames released in 2011 as
compared to videogames released in 2010.
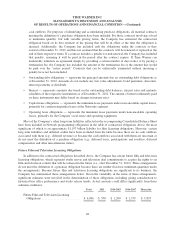
The increase in Costs of revenues reflected higher film and television production costs, print and advertising
costs and other costs. Film and television production costs and print and advertising costs increased mainly due
to the mix of product released. Included in film and television production costs are theatrical film valuation
adjustments as a result of revisions to estimates of ultimate revenue for certain theatrical films. For the years
ended December 31, 2011 and 2010, theatrical film valuation adjustments were $74 million and $78 million,
respectively. Other costs increased primarily due to higher merchandise costs mainly associated with the increase
in videogame sales.
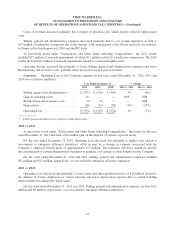
The increase in Selling, general and administrative expenses was primarily due to higher costs associated
with new business initiatives and acquisitions of $60 million, higher employee-related costs of $41 million and
higher distribution fees of $34 million, primarily associated with certain videogames.
As previously noted under “Transactions and Other Items Affecting Comparability,” the 2011 results
included $21 million of noncash impairments, of which $12 million related to capitalized software costs. In
38