Time Magazine 2012 Annual Report Download - page 59
Download and view the complete annual report
Please find page 59 of the 2012 Time Magazine annual report below. You can navigate through the pages in the report by either clicking on the pages listed below, or by using the keyword search tool below to find specific information within the annual report.-
 1
1 -
2
-
3
-
4
-
5
-
6
-
7
-
8
-
9
-
10
-
11
-
12
-
13
-
14
-
15
-
16
-
17
-
18
-
19
-
20
-
21
-
22
-
23
-
24
-
25
-
26
-
27
-
28
-
29
-
30
-
31
-
32
-
33
-
34
-
35
-
36
-
37
-
38
-
39
-
40
-
41
-
42
-
43
-
44
-
45
-
46
-
47
-
48
-
 49
49 -
 50
50 -
 51
51 -
 52
52 -
 53
53 -
 54
54 -
 55
55 -
 56
56 -
 57
57 -
 58
58 -
 59
59 -
 60
60 -
 61
61 -
 62
62 -
 63
63 -
 64
64 -
 65
65 -
 66
66 -
 67
67 -
 68
68 -
 69
69 -
70
-
71
-
72
-
73
-
74
-
75
-
76
-
77
-
78
-
79
-
80
-
81
-
82
-
83
-
84
-
85
-
86
-
87
-
88
-
89
-
90
-
91
-
92
-
93
-
94
-
95
-
96
-
97
-
98
-
99
-
100
-
101
-
102
-
103
-
104
-
105
-
106
-
107
-
108
-
109
-
110
-
111
-
112
-
113
-
114
-
115
-
116
-
117
-
118
-
119
-
120
-
121
-
122
-
123
-
124
-
125
-
126
-
127
-
128
-
129
-
130
-
131
-
132
-
133
-
134
 |
 |

TIME WARNER INC.
MANAGEMENT’S DISCUSSION AND ANALYSIS
OF RESULTS OF OPERATIONS AND FINANCIAL CONDITION – (Continued)
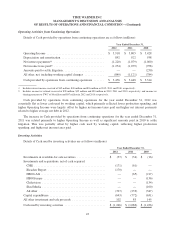
Operating Activities from Continuing Operations
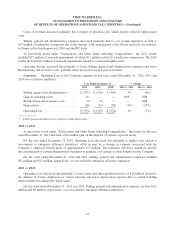
Details of Cash provided by operations from continuing operations are as follows (millions):
Year Ended December 31,
2012 2011 2010
Operating Income ...................................... $ 5,918 $ 5,805 $ 5,428
Depreciation and amortization ............................ 892 922 938
Net interest payments(a) ................................. (1,220) (1,079) (1,060)
Net income taxes paid(b) ................................. (1,274) (1,079) (958)
Amounts paid to settle litigation ........................... — — (250)
All other, net, including working capital changes ............. (840) (1,121) (784)
Cash provided by operations from continuing operations ....... $ 3,476 $ 3,448 $ 3,314
(a) Includes interest income received of $42 million, $40 million and $26 million in 2012, 2011 and 2010, respectively.
(b) Includes income tax refunds received of $78 million, $95 million and $90 million in 2012, 2011 and 2010, respectively, and income tax
sharing payments to TWC of $6 million and $87 million in 2012 and 2010, respectively.
Cash provided by operations from continuing operations for the year ended December 31, 2012 was
essentially flat as lower cash used by working capital, which primarily reflected lower production spending, and
higher Operating Income were largely offset by higher net income taxes paid and higher net interest payments
related to higher average net debt in 2012.
The increase in Cash provided by operations from continuing operations for the year ended December 31,
2011 was related primarily to higher Operating Income as well as significant amounts paid in 2010 to settle
litigation. This was partially offset by higher cash used by working capital, reflecting higher production
spending, and higher net income taxes paid.
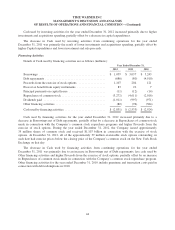
Investing Activities
Details of Cash used by investing activities are as follows (millions):
Year Ended December 31,
2012 2011 2010
Investments in available-for-sale securities ................... $ (37) $ (34) $ (16)
Investments and acquisitions, net of cash acquired:
CME ............................................... (171) (61) —
Bleacher Report ...................................... (170) — —
HBOLAG........................................... — (65) (217)
HBO Europe ......................................... — — (136)
Chilevision .......................................... — — (134)
Shed Media .......................................... — — (100)
All other ............................................ (327) (239) (347)
Capital expenditures ..................................... (643) (772) (631)
All other investment and sale proceeds ...................... 102 85 145
Cash used by investing activities ........................... $ (1,246) $ (1,086) $ (1,436)
43