Time Magazine 2012 Annual Report Download - page 50
Download and view the complete annual report
Please find page 50 of the 2012 Time Magazine annual report below. You can navigate through the pages in the report by either clicking on the pages listed below, or by using the keyword search tool below to find specific information within the annual report.-
 1
1 -
2
-
3
-
4
-
5
-
6
-
7
-
8
-
9
-
10
-
11
-
12
-
13
-
14
-
15
-
16
-
17
-
18
-
19
-
20
-
21
-
22
-
23
-
24
-
25
-
26
-
27
-
28
-
29
-
30
-
31
-
32
-
33
-
34
-
35
-
36
-
37
-
38
-
39
-
 40
40 -
 41
41 -
 42
42 -
 43
43 -
 44
44 -
 45
45 -
 46
46 -
 47
47 -
 48
48 -
 49
49 -
 50
50 -
 51
51 -
 52
52 -
 53
53 -
 54
54 -
 55
55 -
 56
56 -
 57
57 -
 58
58 -
 59
59 -
 60
60 -
61
-
62
-
63
-
64
-
65
-
66
-
67
-
68
-
69
-
70
-
71
-
72
-
73
-
74
-
75
-
76
-
77
-
78
-
79
-
80
-
81
-
82
-
83
-
84
-
85
-
86
-
87
-
88
-
89
-
90
-
91
-
92
-
93
-
94
-
95
-
96
-
97
-
98
-
99
-
100
-
101
-
102
-
103
-
104
-
105
-
106
-
107
-
108
-
109
-
110
-
111
-
112
-
113
-
114
-
115
-
116
-
117
-
118
-
119
-
120
-
121
-
122
-
123
-
124
-
125
-
126
-
127
-
128
-
129
-
130
-
131
-
132
-
133
-
134
 |
 |

TIME WARNER INC.
MANAGEMENT’S DISCUSSION AND ANALYSIS
OF RESULTS OF OPERATIONS AND FINANCIAL CONDITION – (Continued)
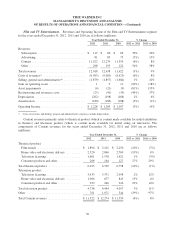
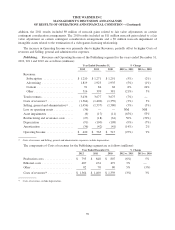
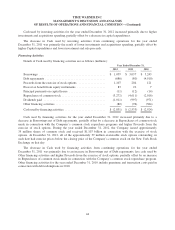
The components of Costs of revenues for the Networks segment are as follows (millions):
Year Ended December 31, % Change
2012 2011 2010 2012 vs. 2011 2011 vs. 2010
Programming costs:
Originals and sports ......................... $ 3,354 $ 3,168 $ 2,661 6% 19%
Acquired films and syndicated series ............ 1,775 1,836 1,824 (3%) 1%
Total programming costs ....................... 5,129 5,004 4,485 2% 12%
Other direct operating costs ..................... 1,437 1,399 1,247 3% 12%
Costs of revenues(a) ........................... $ 6,566 $ 6,403 $ 5,732 3% 12%
(a) Costs of revenues exclude depreciation.
2012 vs. 2011
The increase in Subscription revenues for the year ended December 31, 2012 was primarily due to an
increase in domestic subscription revenues of $457 million driven largely by higher domestic rates and an
increase in international subscription revenues of $47 million reflecting subscriber growth and the unfavorable
impact of foreign exchange rates of approximately $60 million.
The increase in Advertising revenues for the year ended December 31, 2012 primarily reflected domestic
growth of $175 million mainly due to higher pricing and additional National Basketball Association games,
partially offset by lower international advertising revenues of $56 million primarily due to the unfavorable
impact of the Imagine and TNT Turkey Shutdowns and the negative effect of foreign exchange rates of
approximately $30 million.
The decrease in Content revenues for the year ended December 31, 2012 was due primarily to lower
licensing revenues, including lower revenues from the licensing of original programming. In addition, Content
revenues declined due to the shutdown of Turner’s TNT television operations in Turkey.
The increase in Costs of revenues for the year ended December 31, 2012 was driven by higher originals and
sports programming costs, including a $37 million charge related to the cancellation of an original series,
partially offset by lower acquired films and syndicated series programming costs. In addition, the increase in
originals and sports programming costs was partially offset by lower programming costs related to the Imagine
and TNT Turkey Shutdowns.
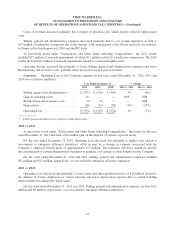
For the year ended December 31, 2012, Selling, general and administrative expenses decreased due primarily
to lower marketing expenses, which were mainly as a result of declines at Home Box Office including the
absence of an HBO GO national marketing campaign in the current year.
As previously noted under “Transactions and Other Items Affecting Comparability,” the results for the year
ended December 31, 2012 reflect the charges incurred in connection with the Imagine and TNT Turkey
Shutdowns, consisting of $174 million primarily related to certain receivables, including value added tax
receivables, inventories and long-lived assets, including Goodwill, and $18 million related to exit and other
transaction costs. The results for the year ended December 31, 2012 also included a $34 million gain on the
settlement of an indemnification obligation related to the Company’s 2007 sale of the Braves. In addition, for the
years ended December 31, 2012 and 2011, the Networks segment incurred $2 million and $6 million,
respectively, of other miscellaneous asset impairments.
34