Time Magazine 2012 Annual Report Download - page 49
Download and view the complete annual report
Please find page 49 of the 2012 Time Magazine annual report below. You can navigate through the pages in the report by either clicking on the pages listed below, or by using the keyword search tool below to find specific information within the annual report.-
 1
1 -
2
-
3
-
4
-
5
-
6
-
7
-
8
-
9
-
10
-
11
-
12
-
13
-
14
-
15
-
16
-
17
-
18
-
19
-
20
-
21
-
22
-
23
-
24
-
25
-
26
-
27
-
28
-
29
-
30
-
31
-
32
-
33
-
34
-
35
-
36
-
37
-
38
-
 39
39 -
 40
40 -
 41
41 -
 42
42 -
 43
43 -
 44
44 -
 45
45 -
 46
46 -
 47
47 -
 48
48 -
 49
49 -
 50
50 -
 51
51 -
 52
52 -
 53
53 -
 54
54 -
 55
55 -
 56
56 -
 57
57 -
 58
58 -
 59
59 -
60
-
61
-
62
-
63
-
64
-
65
-
66
-
67
-
68
-
69
-
70
-
71
-
72
-
73
-
74
-
75
-
76
-
77
-
78
-
79
-
80
-
81
-
82
-
83
-
84
-
85
-
86
-
87
-
88
-
89
-
90
-
91
-
92
-
93
-
94
-
95
-
96
-
97
-
98
-
99
-
100
-
101
-
102
-
103
-
104
-
105
-
106
-
107
-
108
-
109
-
110
-
111
-
112
-
113
-
114
-
115
-
116
-
117
-
118
-
119
-
120
-
121
-
122
-
123
-
124
-
125
-
126
-
127
-
128
-
129
-
130
-
131
-
132
-
133
-
134
 |
 |

TIME WARNER INC.
MANAGEMENT’S DISCUSSION AND ANALYSIS
OF RESULTS OF OPERATIONS AND FINANCIAL CONDITION – (Continued)
The remaining changes in Other loss, net for the year ended December 31, 2012 included an adjustment to
reduce a liability for deferred compensation and higher net losses from equity method investees. For the year
ended December 31, 2011, the remaining change in Other loss, net was due primarily to losses from equity
method investees and the unfavorable impact of foreign exchange rates.
Income Tax Provision. Income tax provision was $1.526 billion, $1.484 billion and $1.348 billion for the
years ended December 31, 2012, 2011 and 2010, respectively. The Company’s effective tax rate was 34% for the
years ended December 31, 2012, 2011 and 2010.
Net Income. Net income was $3.016 billion, $2.882 billion and $2.571 billion for the years ended
December 31, 2012, 2011 and 2010, respectively. Excluding the items noted under “Transactions and Other
Items Affecting Comparability” totaling $184 million, $189 million and $179 million of expense for the years
ended December 31, 2012, 2011 and 2010, respectively, Net income increased $129 million and $321 million in
2012 and 2011, respectively. The increase in both 2012 and 2011 primarily reflected higher Operating Income.
Net Loss Attributable to Noncontrolling Interests. For the years ended December 31, 2012, 2011 and
2010, Net loss attributable to noncontrolling interests was $3 million, $4 million and $7 million, respectively.
Net Income Attributable to Time Warner Inc. Shareholders. Net income attributable to Time Warner Inc.
shareholders was $3.019 billion, $2.886 billion and $2.578 billion for the years ended December 31, 2012, 2011
and 2010, respectively. Basic and Diluted net income per common share attributable to Time Warner Inc.
common shareholders were $3.14 and $3.09, respectively, for the year ended December 31, 2012, $2.74 and
$2.71, respectively, for the year ended December 31, 2011 and $2.27 and $2.25, respectively, for the year ended
December 31, 2010.
Business Segment Results
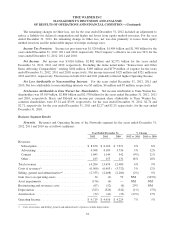
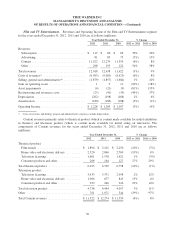
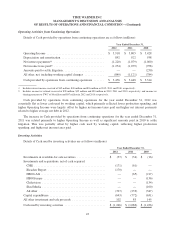
Networks. Revenues and Operating Income of the Networks segment for the years ended December 31,
2012, 2011 and 2010 are as follows (millions):
Year Ended December 31, % Change
2012 2011 2010 2012 vs. 2011 2011 vs. 2010
Revenues:
Subscription ............................... $ 8,670 $ 8,166 $ 7,671 6% 6%
Advertising ................................ 4,308 4,189 3,736 3% 12%
Content ................................... 1,043 1,144 942 (9%) 21%
Other ..................................... 183 155 131 18% 18%
Total revenues ............................... 14,204 13,654 12,480 4% 9%
Costs of revenues(a) ........................... (6,566) (6,403) (5,732) 3% 12%
Selling, general and administrative(a) .............. (2,355) (2,408) (2,200) (2%) 9%
Gain (loss) on operating assets ................... 34 (2) 59 NM (103%)
Asset impairments ............................ (176) (6) — NM NM
Restructuring and severance costs ................ (67) (52) (6) 29% NM
Depreciation ................................. (323) (326) (342) (1%) (5%)
Amortization ................................ (32) (41) (35) (22%) 17%
Operating Income ............................. $ 4,719 $ 4,416 $ 4,224 7% 5%
(a) Costs of revenues and Selling, general and administrative expenses exclude depreciation.
33