Time Magazine 2012 Annual Report Download - page 55
Download and view the complete annual report
Please find page 55 of the 2012 Time Magazine annual report below. You can navigate through the pages in the report by either clicking on the pages listed below, or by using the keyword search tool below to find specific information within the annual report.-
 1
1 -
2
-
3
-
4
-
5
-
6
-
7
-
8
-
9
-
10
-
11
-
12
-
13
-
14
-
15
-
16
-
17
-
18
-
19
-
20
-
21
-
22
-
23
-
24
-
25
-
26
-
27
-
28
-
29
-
30
-
31
-
32
-
33
-
34
-
35
-
36
-
37
-
38
-
39
-
40
-
41
-
42
-
43
-
44
-
 45
45 -
 46
46 -
 47
47 -
 48
48 -
 49
49 -
 50
50 -
 51
51 -
 52
52 -
 53
53 -
 54
54 -
 55
55 -
 56
56 -
 57
57 -
 58
58 -
 59
59 -
 60
60 -
 61
61 -
 62
62 -
 63
63 -
 64
64 -
 65
65 -
66
-
67
-
68
-
69
-
70
-
71
-
72
-
73
-
74
-
75
-
76
-
77
-
78
-
79
-
80
-
81
-
82
-
83
-
84
-
85
-
86
-
87
-
88
-
89
-
90
-
91
-
92
-
93
-
94
-
95
-
96
-
97
-
98
-
99
-
100
-
101
-
102
-
103
-
104
-
105
-
106
-
107
-
108
-
109
-
110
-
111
-
112
-
113
-
114
-
115
-
116
-
117
-
118
-
119
-
120
-
121
-
122
-
123
-
124
-
125
-
126
-
127
-
128
-
129
-
130
-
131
-
132
-
133
-
134
 |
 |

TIME WARNER INC.
MANAGEMENT’S DISCUSSION AND ANALYSIS
OF RESULTS OF OPERATIONS AND FINANCIAL CONDITION – (Continued)
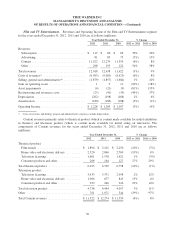
addition, the 2011 results included $9 million of noncash gains related to fair value adjustments on certain
contingent consideration arrangements. The 2010 results included an $11 million noncash gain related to a fair
value adjustment on certain contingent consideration arrangements and a $9 million noncash impairment of
intangible assets related to the termination of a videogames licensing relationship.
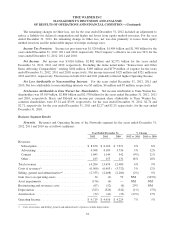
The increase in Operating Income was primarily due to higher Revenues, partially offset by higher Costs of
revenues and Selling, general and administrative expenses.
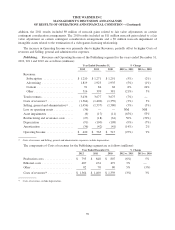
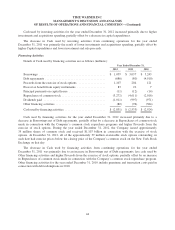
Publishing. Revenues and Operating Income of the Publishing segment for the years ended December 31,
2012, 2011 and 2010 are as follows (millions):
Year Ended December 31, % Change
2012 2011 2010 2012 vs. 2011 2011 vs. 2010
Revenues:
Subscription .................... $1,210 $ 1,271 $ 1,291 (5%) (2%)
Advertising ..................... 1,819 1,923 1,935 (5%) (1%)
Content ........................ 91 84 68 8% 24%
Other .......................... 316 399 381 (21%) 5%
Total revenues ..................... 3,436 3,677 3,675 (7%) —
Costs of revenues(a) ................. (1,364) (1,400) (1,359) (3%) 3%
Selling, general and administrative(a) . . . (1,456) (1,537) (1,580) (5%) (3%)
Loss on operating assets ............. (36) — — NM NM
Asset impairments ................. (6) (17) (11) (65%) 55%
Restructuring and severance costs ..... (27) (18) (61) 50% (70%)
Depreciation ...................... (91) (100) (108) (9%) (7%)
Amortization ...................... (36) (42) (41) (14%) 2%
Operating Income .................. $ 420 $ 563 $ 515 (25%) 9%
(a) Costs of revenues and Selling, general and administrative expenses exclude depreciation.
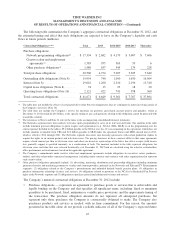
The components of Costs of revenues for the Publishing segment are as follows (millions):
Year Ended December 31, % Change
2012 2011 2010 2012 vs. 2011 2011 vs. 2010
Production costs .................. $ 795 $ 848 $ 807 (6%) 5%
Editorial costs .................... 487 474 472 3% —
Other ........................... 82 78 80 5% (3%)
Costs of revenues(a) ................ $ 1,364 $ 1,400 $ 1,359 (3%) 3%
(a) Costs of revenues exclude depreciation.
39