Time Magazine 2012 Annual Report Download - page 130
Download and view the complete annual report
Please find page 130 of the 2012 Time Magazine annual report below. You can navigate through the pages in the report by either clicking on the pages listed below, or by using the keyword search tool below to find specific information within the annual report.-
 1
1 -
2
-
3
-
4
-
5
-
6
-
7
-
8
-
9
-
10
-
11
-
12
-
13
-
14
-
15
-
16
-
17
-
18
-
19
-
20
-
21
-
22
-
23
-
24
-
25
-
26
-
27
-
28
-
29
-
30
-
31
-
32
-
33
-
34
-
35
-
36
-
37
-
38
-
39
-
40
-
41
-
42
-
43
-
44
-
45
-
46
-
47
-
48
-
49
-
50
-
51
-
52
-
53
-
54
-
55
-
56
-
57
-
58
-
59
-
60
-
61
-
62
-
63
-
64
-
65
-
66
-
67
-
68
-
69
-
70
-
71
-
72
-
73
-
74
-
75
-
76
-
77
-
78
-
79
-
80
-
81
-
82
-
83
-
84
-
85
-
86
-
87
-
88
-
89
-
90
-
91
-
92
-
93
-
94
-
95
-
96
-
97
-
98
-
99
-
100
-
101
-
102
-
103
-
104
-
105
-
106
-
107
-
108
-
109
-
110
-
111
-
112
-
113
-
114
-
115
-
116
-
117
-
118
-
119
-
 120
120 -
 121
121 -
 122
122 -
 123
123 -
 124
124 -
 125
125 -
 126
126 -
 127
127 -
 128
128 -
 129
129 -
 130
130 -
 131
131 -
 132
132 -
 133
133 -
 134
134
 |
 |

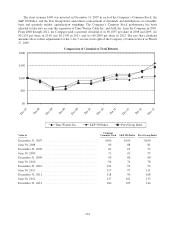
The chart assumes $100 was invested on December 31, 2007 in each of the Company’s Common Stock, the
S&P 500 Index, and the Peer Group Index and reflects reinvestment of dividends and distributions on a monthly
basis and quarterly market capitalization weighting. The Company’s Common Stock performance has been
adjusted to take into account the separation of Time Warner Cable Inc. and AOL Inc. from the Company in 2009.
From 2008 through 2012, the Company paid a quarterly dividend of (i) $0.1875 per share in 2008 and 2009, (ii)
$0.2125 per share in 2010, (iii) $0.2350 in 2011, and (iv) $0.2600 per share in 2012. The per share dividend
amounts above reflect adjustments for the 1-for-3 reverse stock split of the Company’s Common Stock on March
27, 2009.
Dec 12
Jun 12
Dec 11
Jun 11
Dec 10
Jun 10
Dec 09
Jun 09
Dec 08
Jun 08
Dec 07
Comparison of Cumulative Total Returns
$0
$50
$100
$200
$150
Time Warner Inc. S&P 500 Index Peer Group Index
Value at
Company
Common Stock S&P 500 Index Peer Group Index
December 31, 2007 .................................... $100 $100 $100
June 30, 2008 ........................................ 90 88 81
December 31, 2008 .................................... 62 63 53
June 30, 2009 ........................................ 71 65 55
December 31, 2009 .................................... 90 80 80
June 30, 2010 ........................................ 90 74 76
December 31, 2010 .................................... 102 92 95
June 30, 2011 ........................................ 117 97 111
December 31, 2011 .................................... 118 94 108
June 30, 2012 ........................................ 127 102 133
December 31, 2012 .................................... 160 109 146
114