Time Magazine 2012 Annual Report Download - page 110
Download and view the complete annual report
Please find page 110 of the 2012 Time Magazine annual report below. You can navigate through the pages in the report by either clicking on the pages listed below, or by using the keyword search tool below to find specific information within the annual report.-
 1
1 -
2
-
3
-
4
-
5
-
6
-
7
-
8
-
9
-
10
-
11
-
12
-
13
-
14
-
15
-
16
-
17
-
18
-
19
-
20
-
21
-
22
-
23
-
24
-
25
-
26
-
27
-
28
-
29
-
30
-
31
-
32
-
33
-
34
-
35
-
36
-
37
-
38
-
39
-
40
-
41
-
42
-
43
-
44
-
45
-
46
-
47
-
48
-
49
-
50
-
51
-
52
-
53
-
54
-
55
-
56
-
57
-
58
-
59
-
60
-
61
-
62
-
63
-
64
-
65
-
66
-
67
-
68
-
69
-
70
-
71
-
72
-
73
-
74
-
75
-
76
-
77
-
78
-
79
-
80
-
81
-
82
-
83
-
84
-
85
-
86
-
87
-
88
-
89
-
90
-
91
-
92
-
93
-
94
-
95
-
96
-
97
-
98
-
99
-
 100
100 -
 101
101 -
 102
102 -
 103
103 -
 104
104 -
 105
105 -
 106
106 -
 107
107 -
 108
108 -
 109
109 -
 110
110 -
 111
111 -
 112
112 -
 113
113 -
 114
114 -
 115
115 -
 116
116 -
 117
117 -
 118
118 -
 119
119 -
 120
120 -
121
-
122
-
123
-
124
-
125
-
126
-
127
-
128
-
129
-
130
-
131
-
132
-
133
-
134
 |
 |

TIME WARNER INC.
NOTES TO CONSOLIDATED FINANCIAL STATEMENTS – (Continued)
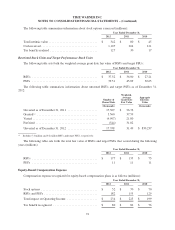
The discount rates were determined by matching the plan’s liability cash flows to rates derived from high-
quality corporate bonds available at the measurement date.
In developing the expected long-term rate of return on plan assets, the Company considered long-term
historical rates of return, the Company’s plan asset allocations as well as the opinions and outlooks of investment
professionals and consulting firms.
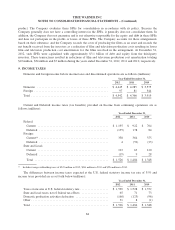
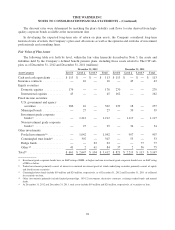
Fair Value of Plan Assets
The following table sets forth by level, within the fair value hierarchy described in Note 5, the assets and
liabilities held by the Company’s defined benefit pension plans, including those assets related to The CW sub-
plan, as of December 31, 2012 and December 31, 2011 (millions):
December 31, 2012 December 31, 2011
Asset Category Level 1 Level 2 Level 3 Total Level 1 Level 2 Level 3 Total
Cash and cash equivalents ........ $ 113 $ —$—$ 113$113$ —$—$ 113
Insurance contracts ............. — 16 — 16 — 43 — 43
Equity securities:
Domestic equities ............ 176 — — 176 270 — — 270
International equities .......... 45 — — 45 162 — — 162
Fixed income securities:
U.S. government and agency
securities ................. 286 16 — 302 239 18 — 257
Municipal bonds ............. — 27 — 27 — 39 — 39
Investment grade corporate
bonds(a) .................. — 1,212 — 1,212 — 1,117 — 1,117
Non-investment grade corporate
bonds(a) .................. — 25 — 25 — 34 — 34
Other investments:
Pooled investments(b) .......... — 1,042 — 1,042 — 907 — 907
Commingled trust funds(c) ...... — 307 — 307 — 53 — 53
Hedge funds ................. — — 63 63 — — 77 77
Other (d) .................... 41 2 41 84 37 2 36 75
Total(e) ....................... $ 661 $ 2,647 $ 104 $ 3,412 $ 821 $ 2,213 $ 113 $ 3,147
(a) Investment grade corporate bonds have an S&P rating of BBB- or higher and non-investment grade corporate bonds have an S&P rating
of BB+ or below.
(b) Pooled investments primarily consist of interests in unitized investment pools of which underlying securities primarily consist of equity
and fixed income securities.
(c) Commingled trust funds include $19 million and $24 million, respectively, as of December 31, 2012 and December 31, 2011 of collateral
for securities on loan.
(d) Other investments primarily include limited partnerships, 103-12 investments, derivative contracts, exchange-traded funds and mutual
funds.
(e) At December 31, 2012 and December 31, 2011, total assets include $19 million and $26 million, respectively, of securities on loan.
94