Time Magazine 2012 Annual Report Download - page 72
Download and view the complete annual report
Please find page 72 of the 2012 Time Magazine annual report below. You can navigate through the pages in the report by either clicking on the pages listed below, or by using the keyword search tool below to find specific information within the annual report.-
 1
1 -
2
-
3
-
4
-
5
-
6
-
7
-
8
-
9
-
10
-
11
-
12
-
13
-
14
-
15
-
16
-
17
-
18
-
19
-
20
-
21
-
22
-
23
-
24
-
25
-
26
-
27
-
28
-
29
-
30
-
31
-
32
-
33
-
34
-
35
-
36
-
37
-
38
-
39
-
40
-
41
-
42
-
43
-
44
-
45
-
46
-
47
-
48
-
49
-
50
-
51
-
52
-
53
-
54
-
55
-
56
-
57
-
58
-
59
-
60
-
61
-
 62
62 -
 63
63 -
 64
64 -
 65
65 -
 66
66 -
 67
67 -
 68
68 -
 69
69 -
 70
70 -
 71
71 -
 72
72 -
 73
73 -
 74
74 -
 75
75 -
 76
76 -
 77
77 -
 78
78 -
 79
79 -
 80
80 -
 81
81 -
 82
82 -
83
-
84
-
85
-
86
-
87
-
88
-
89
-
90
-
91
-
92
-
93
-
94
-
95
-
96
-
97
-
98
-
99
-
100
-
101
-
102
-
103
-
104
-
105
-
106
-
107
-
108
-
109
-
110
-
111
-
112
-
113
-
114
-
115
-
116
-
117
-
118
-
119
-
120
-
121
-
122
-
123
-
124
-
125
-
126
-
127
-
128
-
129
-
130
-
131
-
132
-
133
-
134
 |
 |

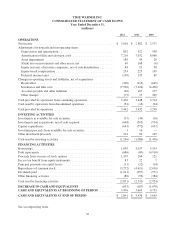
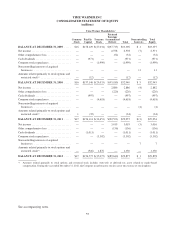
TIME WARNER INC.
CONSOLIDATED STATEMENT OF CASH FLOWS
Year Ended December 31,
(millions)
2012 2011 2010
OPERATIONS
Net income ..................................................... $ 3,016 $ 2,882 $ 2,571
Adjustments for noncash and nonoperating items:
Depreciation and amortization .................................... 892 922 938
Amortization of film and television costs ........................... 7,210 7,032 6,060
Asset impairments ............................................. 186 44 20
(Gain) loss on investments and other assets, net ...................... 69 168 (6)
Equity in losses of investee companies, net of cash distributions ......... 88 95 38
Equity-based compensation ...................................... 234 225 199
Deferred income taxes .......................................... (150) 135 89
Changes in operating assets and liabilities, net of acquisitions:
Receivables ................................................... (360) (613) (645)
Inventories and film costs ....................................... (7,566) (7,624) (6,436)
Accounts payable and other liabilities .............................. (66) 167 177
Other changes ................................................. (77) 15 309
Cash provided by operations from continuing operations ................. 3,476 3,448 3,314
Cash used by operations from discontinued operations ................... (34) (16) (24)
Cash provided by operations ....................................... 3,442 3,432 3,290
INVESTING ACTIVITIES
Investments in available-for-sale securities ............................ (37) (34) (16)
Investments and acquisitions, net of cash acquired ...................... (668) (365) (934)
Capital expenditures .............................................. (643) (772) (631)
Investment proceeds from available-for-sale securities ................... 1 16 —
Other investment proceeds ......................................... 101 69 145
Cash used by investing activities .................................... (1,246) (1,086) (1,436)
FINANCING ACTIVITIES
Borrowings ..................................................... 1,039 3,037 5,243
Debt repayments ................................................. (686) (80) (4,910)
Proceeds from exercise of stock options .............................. 1,107 204 121
Excess tax benefit from equity instruments ............................ 83 22 7
Principal payments on capital leases ................................. (11) (12) (14)
Repurchases of common stock ...................................... (3,272) (4,611) (2,016)
Dividends paid .................................................. (1,011) (997) (971)
Other financing activities .......................................... (80) (96) (384)
Cash used by financing activities .................................... (2,831) (2,533) (2,924)
DECREASE IN CASH AND EQUIVALENTS ....................... (635) (187) (1,070)
CASH AND EQUIVALENTS AT BEGINNING OF PERIOD .......... 3,476 3,663 4,733
CASH AND EQUIVALENTS AT END OF PERIOD ................. $ 2,841 $ 3,476 $ 3,663
See accompanying notes.
56