Time Magazine 2012 Annual Report Download - page 57
Download and view the complete annual report
Please find page 57 of the 2012 Time Magazine annual report below. You can navigate through the pages in the report by either clicking on the pages listed below, or by using the keyword search tool below to find specific information within the annual report.-
 1
1 -
2
-
3
-
4
-
5
-
6
-
7
-
8
-
9
-
10
-
11
-
12
-
13
-
14
-
15
-
16
-
17
-
18
-
19
-
20
-
21
-
22
-
23
-
24
-
25
-
26
-
27
-
28
-
29
-
30
-
31
-
32
-
33
-
34
-
35
-
36
-
37
-
38
-
39
-
40
-
41
-
42
-
43
-
44
-
45
-
46
-
 47
47 -
 48
48 -
 49
49 -
 50
50 -
 51
51 -
 52
52 -
 53
53 -
 54
54 -
 55
55 -
 56
56 -
 57
57 -
 58
58 -
 59
59 -
 60
60 -
 61
61 -
 62
62 -
 63
63 -
 64
64 -
 65
65 -
 66
66 -
 67
67 -
68
-
69
-
70
-
71
-
72
-
73
-
74
-
75
-
76
-
77
-
78
-
79
-
80
-
81
-
82
-
83
-
84
-
85
-
86
-
87
-
88
-
89
-
90
-
91
-
92
-
93
-
94
-
95
-
96
-
97
-
98
-
99
-
100
-
101
-
102
-
103
-
104
-
105
-
106
-
107
-
108
-
109
-
110
-
111
-
112
-
113
-
114
-
115
-
116
-
117
-
118
-
119
-
120
-
121
-
122
-
123
-
124
-
125
-
126
-
127
-
128
-
129
-
130
-
131
-
132
-
133
-
134
 |
 |

TIME WARNER INC.
MANAGEMENT’S DISCUSSION AND ANALYSIS
OF RESULTS OF OPERATIONS AND FINANCIAL CONDITION – (Continued)
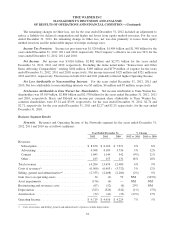
Costs of revenues increased primarily due to higher production costs, which largely reflected higher paper
costs.
Selling, general and administrative expenses decreased primarily due to cost savings initiatives as well as
$17 million of reductions in expenses due to the transfer of the management of the SI.com and Golf.com websites
to Turner in the fourth quarter of 2010 and the IPC Sales.
As previously noted under “Transactions and Other Items Affecting Comparability,” the 2011 results
included $17 million of noncash impairments of which $11 million related to a tradename impairment. The 2010
results included $11 million of noncash impairments related to certain intangible assets.
Operating Income increased due primarily to lower Selling, general and administrative expenses and lower
Restructuring and severance costs, partially offset by an increase in Costs of revenues.
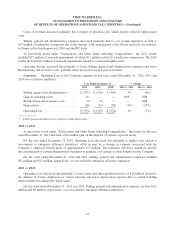
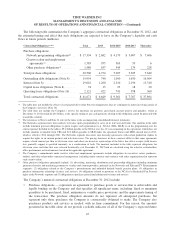
Corporate. Operating Loss of the Corporate segment for the years ended December 31, 2012, 2011 and
2010 was as follows (millions):
Year Ended December 31, % Change
2012 2011 2010 2012 vs. 2011 2011 vs. 2010
Selling, general and administrative(a) .... $ (332) $ (316) $ (336) 5% (6%)
Gain on operating assets .............. 10 — — NM NM
Restructuring and severance costs ....... (2) (2) — — NM
Depreciation ........................ (28) (29) (38) (3%) (24%)
Operating Loss ...................... $ (352) $ (347) $ (374) 1% (7%)
(a) Selling, general and administrative expenses exclude depreciation.
2012 vs. 2011
As previously noted under “Transactions and Other Items Affecting Comparability,” the results for the year
ended December 31, 2012 included a $10 million gain on the disposal of certain corporate assets.
For the year ended December 31, 2012, Operating Loss increased due primarily to higher costs related to
investments in enterprise efficiency initiatives, offset in part by a change in estimate associated with the
Company’s employee benefit plans of approximately $15 million. The enterprise efficiency initiatives involve
the centralization of certain administrative functions to generate cost savings or other benefits for the Company.
For the years ended December 31, 2012 and 2011, Selling, general and administrative expenses included
$51 million and $21 million, respectively, of costs related to enterprise efficiency initiatives.
2011 vs. 2010
Operating Loss decreased due primarily to lower legal and other professional fees of $14 million related to
the defense of former employees in various lawsuits and lower depreciation expense due to certain building
improvements becoming fully depreciated.
For the years ended December 31, 2011 and 2010, Selling, general and administrative expenses included $21
million and $8 million, respectively, of costs related to enterprise efficiency initiatives.
41