Time Magazine 2012 Annual Report Download - page 107
Download and view the complete annual report
Please find page 107 of the 2012 Time Magazine annual report below. You can navigate through the pages in the report by either clicking on the pages listed below, or by using the keyword search tool below to find specific information within the annual report.-
 1
1 -
2
-
3
-
4
-
5
-
6
-
7
-
8
-
9
-
10
-
11
-
12
-
13
-
14
-
15
-
16
-
17
-
18
-
19
-
20
-
21
-
22
-
23
-
24
-
25
-
26
-
27
-
28
-
29
-
30
-
31
-
32
-
33
-
34
-
35
-
36
-
37
-
38
-
39
-
40
-
41
-
42
-
43
-
44
-
45
-
46
-
47
-
48
-
49
-
50
-
51
-
52
-
53
-
54
-
55
-
56
-
57
-
58
-
59
-
60
-
61
-
62
-
63
-
64
-
65
-
66
-
67
-
68
-
69
-
70
-
71
-
72
-
73
-
74
-
75
-
76
-
77
-
78
-
79
-
80
-
81
-
82
-
83
-
84
-
85
-
86
-
87
-
88
-
89
-
90
-
91
-
92
-
93
-
94
-
95
-
96
-
 97
97 -
 98
98 -
 99
99 -
 100
100 -
 101
101 -
 102
102 -
 103
103 -
 104
104 -
 105
105 -
 106
106 -
 107
107 -
 108
108 -
 109
109 -
 110
110 -
 111
111 -
 112
112 -
 113
113 -
 114
114 -
 115
115 -
 116
116 -
 117
117 -
118
-
119
-
120
-
121
-
122
-
123
-
124
-
125
-
126
-
127
-
128
-
129
-
130
-
131
-
132
-
133
-
134
 |
 |

TIME WARNER INC.
NOTES TO CONSOLIDATED FINANCIAL STATEMENTS – (Continued)
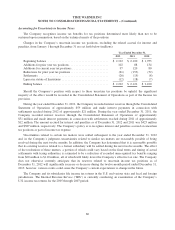
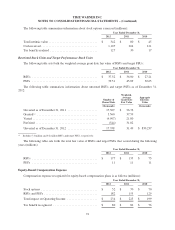
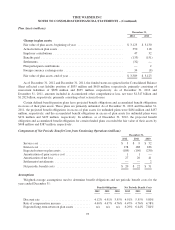
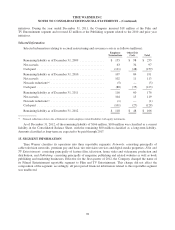
The following table summarizes information about stock options exercised (millions):
Year Ended December 31,
2012 2011 2010
Total intrinsic value ................................ $ 342 $ 80 $ 45
Cash received ..................................... 1,107 204 121
Tax benefits realized ............................... 127 30 17
Restricted Stock Units and Target Performance Stock Units
The following table sets forth the weighted average grant date fair value of RSUs and target PSUs:
Year Ended December 31,
2012 2011 2010
RSUs ........................................... $ 37.52 $ 36.00 $ 27.21
PSUs ........................................... 39.51 45.89 30.65
The following table summarizes information about unvested RSUs and target PSUs as of December 31,
2012:
Number of
Shares/Units
Weighted-
Average
Grant Date
Fair Value
Aggregate
Intrinsic
Value
(thousands) (thousands)
Unvested as of December 31, 2011 .................... 17,309 $ 26.76
Granted(a) ........................................ 5,560 37.59
Vested ........................................... (4,967) 21.80
Forfeited ......................................... (544) 31.82
Unvested as of December 31, 2012 .................... 17,358 31.49 $ 830,237
(a) Includes 5.4 million and 0.2 million RSUs and target PSUs, respectively.
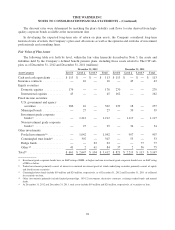
The following table sets forth the total fair value of RSUs and target PSUs that vested during the following
years (millions):
Year Ended December 31,
2012 2011 2010
RSUs ........................................... $ 177 $ 135 $ 75
PSUs ........................................... 11 11 11
Equity-Based Compensation Expense
Compensation expense recognized for equity-based compensation plans is as follows (millions):
Year Ended December 31,
2012 2011 2010
Stock options ..................................... $ 52 $ 70 $ 70
RSUs and PSUs ................................... 182 155 129
Total impact on Operating Income .................... $ 234 $ 225 $ 199
Tax benefit recognized ............................. $ 80 $ 82 $ 76
91