Time Magazine 2012 Annual Report Download - page 115
Download and view the complete annual report
Please find page 115 of the 2012 Time Magazine annual report below. You can navigate through the pages in the report by either clicking on the pages listed below, or by using the keyword search tool below to find specific information within the annual report.-
 1
1 -
2
-
3
-
4
-
5
-
6
-
7
-
8
-
9
-
10
-
11
-
12
-
13
-
14
-
15
-
16
-
17
-
18
-
19
-
20
-
21
-
22
-
23
-
24
-
25
-
26
-
27
-
28
-
29
-
30
-
31
-
32
-
33
-
34
-
35
-
36
-
37
-
38
-
39
-
40
-
41
-
42
-
43
-
44
-
45
-
46
-
47
-
48
-
49
-
50
-
51
-
52
-
53
-
54
-
55
-
56
-
57
-
58
-
59
-
60
-
61
-
62
-
63
-
64
-
65
-
66
-
67
-
68
-
69
-
70
-
71
-
72
-
73
-
74
-
75
-
76
-
77
-
78
-
79
-
80
-
81
-
82
-
83
-
84
-
85
-
86
-
87
-
88
-
89
-
90
-
91
-
92
-
93
-
94
-
95
-
96
-
97
-
98
-
99
-
100
-
101
-
102
-
103
-
104
-
 105
105 -
 106
106 -
 107
107 -
 108
108 -
 109
109 -
 110
110 -
 111
111 -
 112
112 -
 113
113 -
 114
114 -
 115
115 -
 116
116 -
 117
117 -
 118
118 -
 119
119 -
 120
120 -
 121
121 -
 122
122 -
 123
123 -
 124
124 -
 125
125 -
126
-
127
-
128
-
129
-
130
-
131
-
132
-
133
-
134
 |
 |

TIME WARNER INC.
NOTES TO CONSOLIDATED FINANCIAL STATEMENTS – (Continued)
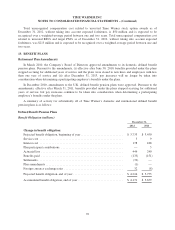
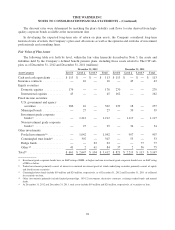
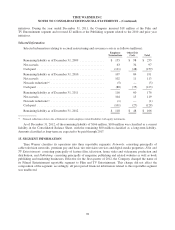
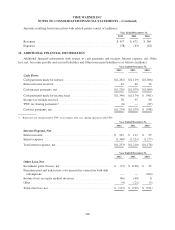
Information as to the Revenues, intersegment revenues, depreciation of property, plant, and equipment,
Amortization of intangible assets, Operating Income (Loss), Assets and Capital expenditures of Time Warner in
each of its reportable segments is set forth below (millions):
Year Ended December 31, 2012
Subscription Advertising Content Other Total
Revenues
Networks ........................ $ 8,670 $ 4,308 $ 1,043 $ 183 $ 14,204
Film and TV Entertainment .......... 117 81 11,522 298 12,018
Publishing ........................ 1,210 1,819 91 316 3,436
Intersegment eliminations ........... — (87) (824) (18) (929)
Total revenues .................... $ 9,997 $ 6,121 $ 11,832 $ 779 $ 28,729
Year Ended December 31, 2011
Subscription Advertising Content Other Total
Revenues
Networks ........................ $ 8,166 $ 4,189 $ 1,144 $ 155 $ 13,654
Film and TV Entertainment .......... 86 85 12,274 193 12,638
Publishing ........................ 1,271 1,923 84 399 3,677
Intersegment eliminations ........... — (81) (867) (47) (995)
Total revenues .................... $ 9,523 $ 6,116 $ 12,635 $ 700 $ 28,974
Year Ended December 31, 2010
Subscription Advertising Content Other Total
Revenues
Networks ........................ $ 7,671 $ 3,736 $ 942 $ 131 $ 12,480
Film and TV Entertainment .......... 66 75 11,359 122 11,622
Publishing ........................ 1,291 1,935 68 381 3,675
Intersegment eliminations ........... — (64) (804) (21) (889)
Total revenues .................... $ 9,028 $ 5,682 $ 11,565 $ 613 $ 26,888
Year Ended December 31,
2012 2011 2010
Intersegment Revenues
Networks .................................................. $ 96 $ 92 $ 89
Film and TV Entertainment .................................... 812 854 778
Publishing ................................................. 21 49 22
Total intersegment revenues ................................... $ 929 $ 995 $ 889
Year Ended December 31,
2012 2011 2010
Depreciation of Property, Plant and Equipment
Networks .................................................. $ (323) $ (326) $ (342)
Film and TV Entertainment .................................... (202) (198) (186)
Publishing ................................................. (91) (100) (108)
Corporate .................................................. (28) (29) (38)
Total depreciation of property, plant and equipment ................ $ (644) $ (653) $ (674)
99