Time Magazine 2012 Annual Report Download - page 116
Download and view the complete annual report
Please find page 116 of the 2012 Time Magazine annual report below. You can navigate through the pages in the report by either clicking on the pages listed below, or by using the keyword search tool below to find specific information within the annual report.-
 1
1 -
2
-
3
-
4
-
5
-
6
-
7
-
8
-
9
-
10
-
11
-
12
-
13
-
14
-
15
-
16
-
17
-
18
-
19
-
20
-
21
-
22
-
23
-
24
-
25
-
26
-
27
-
28
-
29
-
30
-
31
-
32
-
33
-
34
-
35
-
36
-
37
-
38
-
39
-
40
-
41
-
42
-
43
-
44
-
45
-
46
-
47
-
48
-
49
-
50
-
51
-
52
-
53
-
54
-
55
-
56
-
57
-
58
-
59
-
60
-
61
-
62
-
63
-
64
-
65
-
66
-
67
-
68
-
69
-
70
-
71
-
72
-
73
-
74
-
75
-
76
-
77
-
78
-
79
-
80
-
81
-
82
-
83
-
84
-
85
-
86
-
87
-
88
-
89
-
90
-
91
-
92
-
93
-
94
-
95
-
96
-
97
-
98
-
99
-
100
-
101
-
102
-
103
-
104
-
105
-
 106
106 -
 107
107 -
 108
108 -
 109
109 -
 110
110 -
 111
111 -
 112
112 -
 113
113 -
 114
114 -
 115
115 -
 116
116 -
 117
117 -
 118
118 -
 119
119 -
 120
120 -
 121
121 -
 122
122 -
 123
123 -
 124
124 -
 125
125 -
 126
126 -
127
-
128
-
129
-
130
-
131
-
132
-
133
-
134
 |
 |

TIME WARNER INC.
NOTES TO CONSOLIDATED FINANCIAL STATEMENTS – (Continued)
Year Ended December 31,
2012 2011 2010
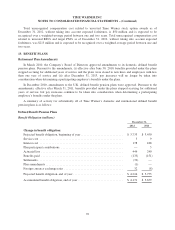
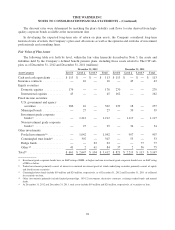
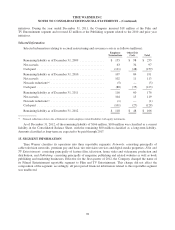
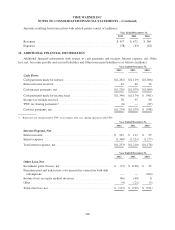
Amortization of Intangible Assets
Networks ................................................ $ (32) $ (41) $ (35)
Film and TV Entertainment ................................. (180) (186) (188)
Publishing ............................................... (36) (42) (41)
Total amortization of intangible assets ......................... $ (248) $ (269) $ (264)
Year Ended December 31,
2012 2011 2010
Operating Income (Loss)
Networks ................................................ $ 4,719 $ 4,416 $ 4,224
Film and TV Entertainment ................................. 1,228 1,263 1,107
Publishing ............................................... 420 563 515
Corporate ............................................... (352) (347) (374)
Intersegment eliminations ................................... (97) (90) (44)
Total operating income (loss) ................................ $ 5,918 $ 5,805 $ 5,428
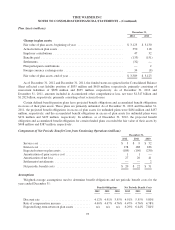
December 31,
2012
December 31,
2011
Assets
Networks ................................................... $ 39,002 $ 38,166
Film and TV Entertainment ..................................... 19,853 19,257
Publishing ................................................... 5,850 6,055
Corporate ................................................... 3,599 4,323
Total assets .................................................. $ 68,304 $ 67,801
Year Ended December 31,
2012 2011 2010
Capital Expenditures
Networks ............................................... $ 294 $ 330 $ 291
Film and TV Entertainment ................................. 270 313 272
Publishing ............................................... 34 48 49
Corporate ............................................... 45 81 19
Total capital expenditures .................................. $ 643 $ 772 $ 631
100