Time Magazine 2012 Annual Report Download - page 47
Download and view the complete annual report
Please find page 47 of the 2012 Time Magazine annual report below. You can navigate through the pages in the report by either clicking on the pages listed below, or by using the keyword search tool below to find specific information within the annual report.-
 1
1 -
2
-
3
-
4
-
5
-
6
-
7
-
8
-
9
-
10
-
11
-
12
-
13
-
14
-
15
-
16
-
17
-
18
-
19
-
20
-
21
-
22
-
23
-
24
-
25
-
26
-
27
-
28
-
29
-
30
-
31
-
32
-
33
-
34
-
35
-
36
-
 37
37 -
 38
38 -
 39
39 -
 40
40 -
 41
41 -
 42
42 -
 43
43 -
 44
44 -
 45
45 -
 46
46 -
 47
47 -
 48
48 -
 49
49 -
 50
50 -
 51
51 -
 52
52 -
 53
53 -
 54
54 -
 55
55 -
 56
56 -
 57
57 -
58
-
59
-
60
-
61
-
62
-
63
-
64
-
65
-
66
-
67
-
68
-
69
-
70
-
71
-
72
-
73
-
74
-
75
-
76
-
77
-
78
-
79
-
80
-
81
-
82
-
83
-
84
-
85
-
86
-
87
-
88
-
89
-
90
-
91
-
92
-
93
-
94
-
95
-
96
-
97
-
98
-
99
-
100
-
101
-
102
-
103
-
104
-
105
-
106
-
107
-
108
-
109
-
110
-
111
-
112
-
113
-
114
-
115
-
116
-
117
-
118
-
119
-
120
-
121
-
122
-
123
-
124
-
125
-
126
-
127
-
128
-
129
-
130
-
131
-
132
-
133
-
134
 |
 |

TIME WARNER INC.
MANAGEMENT’S DISCUSSION AND ANALYSIS
OF RESULTS OF OPERATIONS AND FINANCIAL CONDITION – (Continued)
Consolidated Results
The following discussion provides an analysis of the Company’s results of operations and should be read in
conjunction with the accompanying Consolidated Statement of Operations.
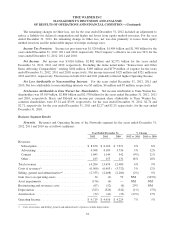
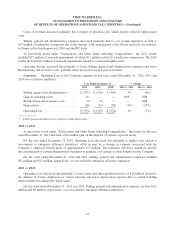
Revenues. The components of Revenues are as follows (millions):
Year Ended December 31, % Change
2012 2011 2010 2012 vs. 2011 2011 vs. 2010
Subscription .................. $ 9,997 $ 9,523 $ 9,028 5% 5%
Advertising ................... 6,121 6,116 5,682 — 8%
Content ...................... 11,832 12,635 11,565 (6%) 9%
Other ........................ 779 700 613 11% 14%
Total revenues ................. $ 28,729 $ 28,974 $ 26,888 (1%) 8%
For the year ended December 31, 2012, the increase in Subscription revenues was primarily related to an
increase at the Networks segment. Advertising revenues for the year ended December 31, 2012 were essentially
flat as an increase at the Networks segment was largely offset by a decrease at the Publishing segment. The
decrease in Content revenues for the year ended December 31, 2012 was due primarily to decreases at the Film
and TV Entertainment and Networks segments. The increase in Other revenues for the year ended December 31,
2012 was primarily related to an increase at the Film and TV Entertainment segment, partially offset by a decline
at the Publishing segment.
For the year ended December 31, 2011, the increase in Subscription and Advertising revenues was primarily
related to an increase at the Networks segment. The increase in Content revenues for the year ended
December 31, 2011 was due primarily to increases at the Film and TV Entertainment and Networks segments.
Each of the revenue categories is discussed in greater detail by segment in “Business Segment Results.”
Costs of Revenues. Costs of revenues were $15.934 billion, $16.311 billion and $15.023 billion for the
years ended December 31, 2012, 2011 and 2010, respectively. The decrease for the year ended December 31,
2012 reflected declines at the Film and TV Entertainment and Publishing segments, partially offset by an
increase at the Networks segment. The increase for the year ended December 31, 2011 was driven primarily by
increases at the Networks and Film and TV Entertainment segments. The segment variations are discussed in
“Business Segment Results.”
Selling, General and Administrative Expenses. Selling, general and administrative expenses were
$6.333 billion, $6.439 billion and $6.126 billion for the years ended December 31, 2012, 2011 and 2010,
respectively. The decrease for the year ended December 31, 2012 primarily related to declines at the Publishing
and Networks segments, partly offset by increases at the Film and TV Entertainment and Corporate segments.
The increase for the year ended December 31, 2011 primarily related to increases at the Networks and Film and
TV Entertainment segments. The segment variations are discussed in “Business Segment Results.”
Included in Costs of revenues and Selling, general and administrative expenses is depreciation expense of
$644 million, $653 million and $674 million for the years ended December 31, 2012, 2011 and 2010,
respectively.
Amortization Expense. Amortization expense was $248 million, $269 million and $264 million for the
years ended December 31, 2012, 2011 and 2010, respectively.
31