Time Magazine 2012 Annual Report Download - page 109
Download and view the complete annual report
Please find page 109 of the 2012 Time Magazine annual report below. You can navigate through the pages in the report by either clicking on the pages listed below, or by using the keyword search tool below to find specific information within the annual report.-
 1
1 -
2
-
3
-
4
-
5
-
6
-
7
-
8
-
9
-
10
-
11
-
12
-
13
-
14
-
15
-
16
-
17
-
18
-
19
-
20
-
21
-
22
-
23
-
24
-
25
-
26
-
27
-
28
-
29
-
30
-
31
-
32
-
33
-
34
-
35
-
36
-
37
-
38
-
39
-
40
-
41
-
42
-
43
-
44
-
45
-
46
-
47
-
48
-
49
-
50
-
51
-
52
-
53
-
54
-
55
-
56
-
57
-
58
-
59
-
60
-
61
-
62
-
63
-
64
-
65
-
66
-
67
-
68
-
69
-
70
-
71
-
72
-
73
-
74
-
75
-
76
-
77
-
78
-
79
-
80
-
81
-
82
-
83
-
84
-
85
-
86
-
87
-
88
-
89
-
90
-
91
-
92
-
93
-
94
-
95
-
96
-
97
-
98
-
 99
99 -
 100
100 -
 101
101 -
 102
102 -
 103
103 -
 104
104 -
 105
105 -
 106
106 -
 107
107 -
 108
108 -
 109
109 -
 110
110 -
 111
111 -
 112
112 -
 113
113 -
 114
114 -
 115
115 -
 116
116 -
 117
117 -
 118
118 -
 119
119 -
120
-
121
-
122
-
123
-
124
-
125
-
126
-
127
-
128
-
129
-
130
-
131
-
132
-
133
-
134
 |
 |

TIME WARNER INC.
NOTES TO CONSOLIDATED FINANCIAL STATEMENTS – (Continued)
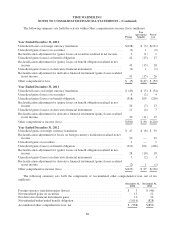
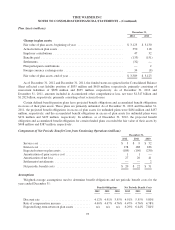
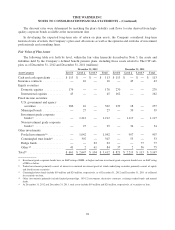
Plan Assets (millions)
December 31,
2012 2011
Change in plan assets:
Fair value of plan assets, beginning of year .............................. $ 3,123 $ 3,130
Actual return on plan assets ........................................... 350 118
Employer contributions .............................................. 47 32
Benefits paid ...................................................... (133) (151)
Settlements ........................................................ (32) —
Plan participant contributions ......................................... — 2
Foreign currency exchange rates ....................................... 34 (8)
Fair value of plan assets, end of year .................................... $ 3,389 $ 3,123
As of December 31, 2012 and December 31, 2011, the funded status recognized in the Consolidated Balance
Sheet reflected a net liability position of $835 million and $610 million, respectively, primarily consisting of
noncurrent liabilities of $858 million and $625 million, respectively. As of December 31, 2012 and
December 31, 2011, amounts included in Accumulated other comprehensive loss, net were $1.547 billion and
$1.282 billion, respectively, primarily consisting of net actuarial losses.
Certain defined benefit pension plans have projected benefit obligations and accumulated benefit obligations
in excess of their plan assets. These plans are primarily unfunded. As of December 31, 2012 and December 31,
2011, the projected benefit obligations in excess of plan assets for unfunded plans were $484 million and $437
million, respectively, and the accumulated benefit obligations in excess of plan assets for unfunded plans were
$474 million and $429 million, respectively. In addition, as of December 31, 2012, the projected benefit
obligation and accumulated benefit obligation for certain funded plans exceeded the fair value of their assets by
$408 million and $387 million, respectively.
Components of Net Periodic Benefit Costs from Continuing Operations (millions)
December 31,
2012 2011 2010
Service cost ................................................... $ 3 $ 9 $ 52
Interest cost ................................................... 178 188 186
Expected return on plan assets ..................................... (189) (196) (230)
Amortization of prior service cost .................................. 1 1 —
Amortization of net loss ......................................... 27 20 41
Settlements/curtailments ......................................... — — 2
Net periodic benefit costs ........................................ $ 20 $ 22 $ 51
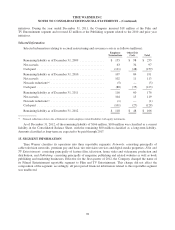
Assumptions
Weighted-average assumptions used to determine benefit obligations and net periodic benefit costs for the
years ended December 31:
Benefit Obligations Net Periodic Benefit Costs
2012 2011 2010 2012 2011 2010
Discount rate ................................ 4.12% 4.91% 5.55% 4.91% 5.55% 5.80%
Rate of compensation increase ................... 4.40% 4.47% 4.76% 4.47% 4.76% 4.78%
Expected long-term return on plan assets .......... n/a n/a n/a 6.29% 6.44% 7.84%
93