Time Magazine 2012 Annual Report Download - page 73
Download and view the complete annual report
Please find page 73 of the 2012 Time Magazine annual report below. You can navigate through the pages in the report by either clicking on the pages listed below, or by using the keyword search tool below to find specific information within the annual report.-
 1
1 -
2
-
3
-
4
-
5
-
6
-
7
-
8
-
9
-
10
-
11
-
12
-
13
-
14
-
15
-
16
-
17
-
18
-
19
-
20
-
21
-
22
-
23
-
24
-
25
-
26
-
27
-
28
-
29
-
30
-
31
-
32
-
33
-
34
-
35
-
36
-
37
-
38
-
39
-
40
-
41
-
42
-
43
-
44
-
45
-
46
-
47
-
48
-
49
-
50
-
51
-
52
-
53
-
54
-
55
-
56
-
57
-
58
-
59
-
60
-
61
-
62
-
 63
63 -
 64
64 -
 65
65 -
 66
66 -
 67
67 -
 68
68 -
 69
69 -
 70
70 -
 71
71 -
 72
72 -
 73
73 -
 74
74 -
 75
75 -
 76
76 -
 77
77 -
 78
78 -
 79
79 -
 80
80 -
 81
81 -
 82
82 -
 83
83 -
84
-
85
-
86
-
87
-
88
-
89
-
90
-
91
-
92
-
93
-
94
-
95
-
96
-
97
-
98
-
99
-
100
-
101
-
102
-
103
-
104
-
105
-
106
-
107
-
108
-
109
-
110
-
111
-
112
-
113
-
114
-
115
-
116
-
117
-
118
-
119
-
120
-
121
-
122
-
123
-
124
-
125
-
126
-
127
-
128
-
129
-
130
-
131
-
132
-
133
-
134
 |
 |

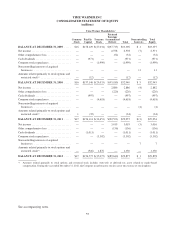
TIME WARNER INC.
CONSOLIDATED STATEMENT OF EQUITY
(millions)
Time Warner Shareholders’
Common
Stock
Paid-In
Capital
Treasury
Stock
Retained
Earnings
(Accumulated
Deficit) Total
Noncontrolling
Interests
Total
Equity
BALANCE AT DECEMBER 31, 2009 ..... $16 $158,129 $(27,034) $(97,715) $33,396 $ 1 $33,397
Net income ............................. — — — 2,578 2,578 (7) 2,571
Other comprehensive loss ................. — — — (52) (52) — (52)
Cash dividends .......................... — (971) — — (971) — (971)
Common stock repurchases ................ — — (1,999) — (1,999) — (1,999)
Noncontrolling interests of acquired
businesses ........................... — — — — — 11 11
Amounts related primarily to stock options and
restricted stock(a) ...................... — (12) — — (12) — (12)
BALANCE AT DECEMBER 31, 2010 ..... $16 $157,146 $(29,033) $(95,189) $32,940 $ 5 $32,945
Net income ............................. — — — 2,886 2,886 (4) 2,882
Other comprehensive loss ................. — — — (220) (220) — (220)
Cash dividends .......................... — (997) — — (997) — (997)
Common stock repurchases ................ — — (4,618) — (4,618) — (4,618)
Noncontrolling interests of acquired
businesses ........................... — — — — — (4) (4)
Amounts related primarily to stock options and
restricted stock(a) ...................... 1 (35) — — (34) — (34)
BALANCE AT DECEMBER 31, 2011 ..... $17 $156,114 $(33,651) $(92,523) $29,957 $ (3) $29,954
Net income ............................. — — — 3,019 3,019 (3) 3,016
Other comprehensive loss ................. — — — (136) (136) — (136)
Cash dividends .......................... — (1,011) — — (1,011) — (1,011)
Common stock repurchases ................ — — (3,302) — (3,302) — (3,302)
Noncontrolling interests of acquired
businesses ........................... — — — — — 7 7
Amounts related primarily to stock options and
restricted stock(a) ...................... — (526) 1,876 — 1,350 — 1,350
BALANCE AT DECEMBER 31, 2012 ..... $17 $154,577 $(35,077) $(89,640) $29,877 $ 1 $29,878
(a) Amounts related primarily to stock options and restricted stock includes write-offs of deferred tax assets related to equity-based
compensation. During the year ended December 31, 2012, the Company issued treasury stock to cover the exercise of stock options.
See accompanying notes.
57