Saks Fifth Avenue 2009 Annual Report Download - page 97
Download and view the complete annual report
Please find page 97 of the 2009 Saks Fifth Avenue annual report below. You can navigate through the pages in the report by either clicking on the pages listed below, or by using the keyword search tool below to find specific information within the annual report.-
 1
1 -
2
-
3
-
4
-
5
-
6
-
7
-
8
-
9
-
10
-
11
-
12
-
13
-
14
-
15
-
16
-
17
-
18
-
19
-
20
-
21
-
22
-
23
-
24
-
25
-
26
-
27
-
28
-
29
-
30
-
31
-
32
-
33
-
34
-
35
-
36
-
37
-
38
-
39
-
40
-
41
-
42
-
43
-
44
-
45
-
46
-
47
-
48
-
49
-
50
-
51
-
52
-
53
-
54
-
55
-
56
-
57
-
58
-
59
-
60
-
61
-
62
-
63
-
64
-
65
-
66
-
67
-
68
-
69
-
70
-
71
-
72
-
73
-
74
-
75
-
76
-
77
-
78
-
79
-
80
-
81
-
82
-
83
-
84
-
85
-
86
-
 87
87 -
 88
88 -
 89
89 -
 90
90 -
 91
91 -
 92
92 -
 93
93 -
 94
94 -
 95
95 -
 96
96 -
 97
97 -
 98
98 -
 99
99 -
 100
100 -
 101
101 -
 102
102 -
 103
103 -
 104
104 -
 105
105 -
 106
106 -
 107
107 -
108
-
109
-
110
-
111
-
112
-
113
-
114
-
115
-
116
-
117
-
118
-
119
-
120
-
121
-
122
-
123
-
124
-
125
-
126
-
127
-
128
-
129
-
130
-
131
-
132
-
133
-
134
-
135
-
136
-
137
-
138
-
139
-
140
-
141
-
142
 |
 |

Table of Contents
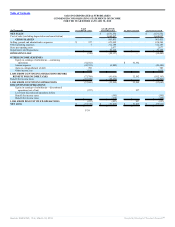
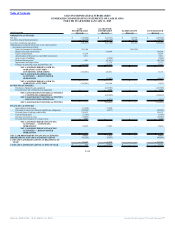
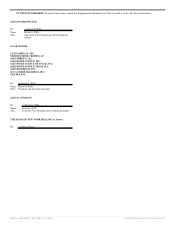
SAKS INCORPORATED & SUBSIDIARIES
CONDENSED CONSOLIDATING STATEMENTS OF CASH FLOWS
FOR THE YEAR ENDED JANUARY 30, 2010
(In Thousands)
SAKS
INCORPORATED
GUARANTOR
SUBSIDIARIES ELIMINATIONS CONSOLIDATED
OPERATING ACTIVITIES
Net loss $ (57,919) $ (32,819) $ 32,819 $ (57,919)
Loss from discontinued operations (257) (257) 257 (257)
Loss from continuing operations (57,662) (32,562) 32,562 (57,662)
Adjustments to reconcile net loss to net Cash provided by (used
in) operating activities:
Equity in earnings of subsidiaries 32,562 — (32,562) —
Depreciation and amortization 135,162 135,162
Equity compensation 16,846 16,846
Amortization of discount on convertible senior notes 9,819 9,819
Gain on debt extinguishment (783) (783)
Deferred income taxes 1,886 (42,471) (40,585)
Impairments and dispositions 29,348 29,348
Gain on sale of property (628) (628)
Changes in operating assets and liabilities, net (9,142) 123,500 114,358
NET CASH PROVIDED BY (USED IN)
OPERATING ACTIVITIES —
CONTINUING OPERATIONS (6,474) 212,349 — 205,875
NET CASH USED IN OPERATING
ACTIVITIES — DISCONTINUED
OPERATIONS (13,670) (13,670)
NET CASH PROVIDED BY (USED IN)
OPERATING ACTIVITIES (6,474) 198,679 — 192,205
INVESTING ACTIVITIES
Purchases of property and equipment — (74,577) — (74,577)
Proceeds from sale of property and equipment 643 643
NET CASH USED IN INVESTING
ACTIVITIES — CONTINUING
OPERATIONS — (73,934) — (73,934)
NET CASH USED IN INVESTING
ACTIVITIES — DISCONTINUED
OPERATIONS — —
NET CASH USED IN INVESTING
ACTIVITIES — (73,934) — (73,934)
FINANCING ACTIVITIES
Intercompany borrowings 119,155 (119,155) — —
Proceeds from issuance of convertible senior notes 120,000 120,000
Payments of deferred financing costs (13,105) (13,105)
Payments on revolving credit facility (156,675) (156,675)
Cash dividends paid (781) (781)
Payments on long-term debt and capital lease obligations (22,208) (4,673) (26,881)
Net proceeds from issuance of common stock 96,199 96,199
NET CASH PROVIDED BY (USED IN)
FINANCING ACTIVITIES —
CONTINUING OPERATIONS 142,585 (123,828) — 18,757
NET CASH PROVIDED BY FINANCING
ACTIVITIES — DISCONTINUED
OPERATIONS — — — —
NET CASH PROVIDED BY (USED IN)
FINANCING ACTIVITIES 142,585 (123,828) — 18,757
INCREASE IN CASH AND CASH EQUIVALENTS 136,111 917 — 137,028
CASH AND CASH EQUIVALENTS AT BEGINNING OF
YEAR 236 10,037 — 10,273
CASH AND CASH EQUIVALENTS AT END OF YEAR $ 136,347 $ 10,954 $ — $ 147,301
F-41
Source: SAKS INC, 10-K, March 18, 2010 Powered by Morningstar® Document Research℠