Saks Fifth Avenue 2009 Annual Report Download - page 88
Download and view the complete annual report
Please find page 88 of the 2009 Saks Fifth Avenue annual report below. You can navigate through the pages in the report by either clicking on the pages listed below, or by using the keyword search tool below to find specific information within the annual report.-
 1
1 -
2
-
3
-
4
-
5
-
6
-
7
-
8
-
9
-
10
-
11
-
12
-
13
-
14
-
15
-
16
-
17
-
18
-
19
-
20
-
21
-
22
-
23
-
24
-
25
-
26
-
27
-
28
-
29
-
30
-
31
-
32
-
33
-
34
-
35
-
36
-
37
-
38
-
39
-
40
-
41
-
42
-
43
-
44
-
45
-
46
-
47
-
48
-
49
-
50
-
51
-
52
-
53
-
54
-
55
-
56
-
57
-
58
-
59
-
60
-
61
-
62
-
63
-
64
-
65
-
66
-
67
-
68
-
69
-
70
-
71
-
72
-
73
-
74
-
75
-
76
-
77
-
 78
78 -
 79
79 -
 80
80 -
 81
81 -
 82
82 -
 83
83 -
 84
84 -
 85
85 -
 86
86 -
 87
87 -
 88
88 -
 89
89 -
 90
90 -
 91
91 -
 92
92 -
 93
93 -
 94
94 -
 95
95 -
 96
96 -
 97
97 -
 98
98 -
99
-
100
-
101
-
102
-
103
-
104
-
105
-
106
-
107
-
108
-
109
-
110
-
111
-
112
-
113
-
114
-
115
-
116
-
117
-
118
-
119
-
120
-
121
-
122
-
123
-
124
-
125
-
126
-
127
-
128
-
129
-
130
-
131
-
132
-
133
-
134
-
135
-
136
-
137
-
138
-
139
-
140
-
141
-
142
 |
 |

Table of Contents
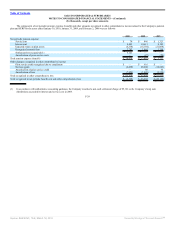
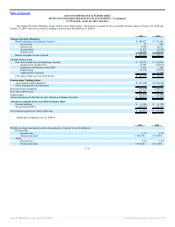
SAKS INCORPORATED & SUBSIDIARIES
NOTES TO CONSOLIDATED FINANCIAL STATEMENTS—(Continued)
(In thousands, except per share amounts)
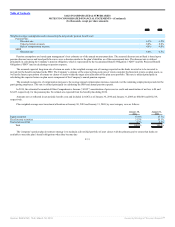
while maintaining an appropriate level of risk control. The plan’s target allocation is determined by the Company’s Retirement Committee, taking into
consideration the amounts and timing of projected liabilities, the Company’s funding policies and expected returns on various asset categories, as well as the risk
characteristics of and correlations among the various asset classes. Long term rate of return assumptions are developed using historical data on various asset
classes. For the years ended January 31, 2009 and January 30, 2010, the plan’s target asset allocation was approximately 65% equity, 30% fixed income and 5%
real estate. Equity securities include investments in both large-cap and small-cap companies. Fixed income securities include government bonds, corporate bonds
of companies in diversified industries and mortgage-backed securities.
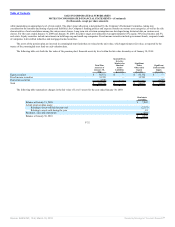
The assets of the pension plan are invested in commingled trust funds that are valued at the unit value, which approximates fair value, as reported by the
trustee of the commingled trust fund on each valuation date.
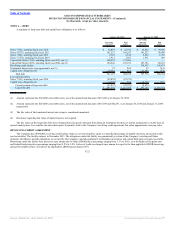
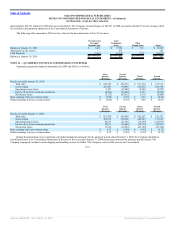
The following table sets forth the fair value of the pension plan’s financial assets by level within the fair value hierarchy as of January 30, 2010:
Total Plan
Assets as of
January 30,
2010
Quoted Prices
In Active
Markets for
Identical
Assets/
Liabilities
(Level 1)
Significant
Other
Observable
Inputs
(Level 2)
Significant
Unobservable
Inputs
(Level 3)
Equity securities $ 66,172 $ — $ 66,172 $ —
Fixed income securities 32,705 — 32,705 —
Real estate securities 4,878 — — 4,878
Total $ 103,755 $ — $ 98,877 $ 4,878
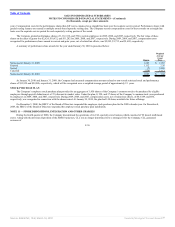
The following table summarizes changes in the fair value of Level 3 assets for the year ended January 30, 2010:
Real estate
securities
Balance at January 31, 2009 $ 7,843
Actual return on plan assets:
Relating to assets still held at year-end (2,757)
Relating to assets sold during the year 81
Purchases, sales and settlements (289)
Balance at January 30, 2010 $ 4,878
F-32
Source: SAKS INC, 10-K, March 18, 2010 Powered by Morningstar® Document Research℠