Saks Fifth Avenue 2009 Annual Report Download - page 30
Download and view the complete annual report
Please find page 30 of the 2009 Saks Fifth Avenue annual report below. You can navigate through the pages in the report by either clicking on the pages listed below, or by using the keyword search tool below to find specific information within the annual report.-
 1
1 -
2
-
3
-
4
-
5
-
6
-
7
-
8
-
9
-
10
-
11
-
12
-
13
-
14
-
15
-
16
-
17
-
18
-
19
-
 20
20 -
 21
21 -
 22
22 -
 23
23 -
 24
24 -
 25
25 -
 26
26 -
 27
27 -
 28
28 -
 29
29 -
 30
30 -
 31
31 -
 32
32 -
 33
33 -
 34
34 -
 35
35 -
 36
36 -
 37
37 -
 38
38 -
 39
39 -
 40
40 -
41
-
42
-
43
-
44
-
45
-
46
-
47
-
48
-
49
-
50
-
51
-
52
-
53
-
54
-
55
-
56
-
57
-
58
-
59
-
60
-
61
-
62
-
63
-
64
-
65
-
66
-
67
-
68
-
69
-
70
-
71
-
72
-
73
-
74
-
75
-
76
-
77
-
78
-
79
-
80
-
81
-
82
-
83
-
84
-
85
-
86
-
87
-
88
-
89
-
90
-
91
-
92
-
93
-
94
-
95
-
96
-
97
-
98
-
99
-
100
-
101
-
102
-
103
-
104
-
105
-
106
-
107
-
108
-
109
-
110
-
111
-
112
-
113
-
114
-
115
-
116
-
117
-
118
-
119
-
120
-
121
-
122
-
123
-
124
-
125
-
126
-
127
-
128
-
129
-
130
-
131
-
132
-
133
-
134
-
135
-
136
-
137
-
138
-
139
-
140
-
141
-
142
 |
 |

Table of Contents
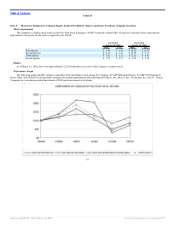
For the year ended January 31, 2009, the Company’s operating loss totaled $135.4 million, a 760 basis point decrease as a percentage of net sales from
operating income of $102.9 million in the same period last year. Operating loss was driven by a 6.1% decrease in comparable store sales and a gross margin rate
decline of 690 basis points for the year ended January 31, 2009. The decline in gross margin dollars and the gross margin rate was principally due to aggressive
markdowns taken in the fourth quarter of 2008 as the Company initiated promotional activities in an effort to stimulate consumer demand and reduce inventory
levels.
NET SALES
For the year ended January 31, 2009, total sales decreased 6.0% to $3,043.4 million from $3,237.3 million for the year ended February 2, 2008.
Consolidated comparable store sales decreased $197.3 million, or 6.1%, from $3,211.7 million for the year ended February 2, 2008 to $3,014.4 million for the
year ended January 31, 2009.
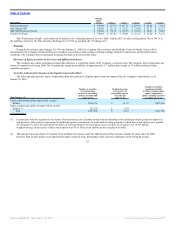
GROSS MARGIN
For the year ended January 31, 2009, gross margin was $980.9 million, or 32.2% of net sales, compared to $1,265.0 million, or 39.1% of net sales, for the
year ended February 2, 2008. The decline in gross margin dollars and gross margin rate was primarily driven by aggressive markdowns as the Company reacted
to the rapidly deteriorating economic conditions and worked to clear excess inventory.
SELLING, GENERAL AND ADMINISTRATIVE EXPENSES
For the year ended January 31, 2009, SG&A was $784.5 million, or 25.8% of net sales, compared to $840.8 million, or 26.0% of net sales, for the year
ended February 2, 2008. The decrease of $56.3 million in expenses was primarily driven by lower variable expenses associated with the year-over-year sales
decrease of $193.8 million, general expense reduction and a decrease in severance, retention, and transition costs of $19.6 million from the prior year. As a
percentage of sales, SG&A decreased by 20 basis points over the prior year.
Amounts received from vendors in conjunction with compensation programs and cooperative advertising were consistent with the related gross
compensation and cooperative advertising expenditures and therefore had no significant impact on SG&A expense, in dollars or as a percentage of net sales.
OTHER OPERATING EXPENSES
For the year ended January 31, 2009, other operating expenses were $320.7 million, or 10.6% of net sales, compared to $317.0 million, or 9.8% of net
sales, for the year ended February 2, 2008. The increase of $3.7 million was principally driven by higher depreciation and amortization expense and property and
equipment rentals of $3.0 million and $1.0 million, respectively and an increase in store pre-opening costs of $1.6 million. These increases were partially offset
by a decrease in taxes other than income taxes of $1.9 million.
IMPAIRMENTS AND DISPOSITIONS
For the year ended January 31, 2009, the Company recognized net charges from impairments and dispositions of $11.1 million compared to charges of
$4.3 million for the year ended February 2, 2008. The current and prior year net charges were primarily due to asset impairments in the normal course of
business.
INTEREST EXPENSE
Interest expense decreased to $45.7 million in 2008 from $48.3 million in 2007 and, as a percentage of net sales, was 1.5% in 2008 and 2007. The decrease
of $2.6 million was primarily due to lower interest rates due in
28
Source: SAKS INC, 10-K, March 18, 2010 Powered by Morningstar® Document Research℠