Saks Fifth Avenue 2009 Annual Report Download - page 74
Download and view the complete annual report
Please find page 74 of the 2009 Saks Fifth Avenue annual report below. You can navigate through the pages in the report by either clicking on the pages listed below, or by using the keyword search tool below to find specific information within the annual report.-
 1
1 -
2
-
3
-
4
-
5
-
6
-
7
-
8
-
9
-
10
-
11
-
12
-
13
-
14
-
15
-
16
-
17
-
18
-
19
-
20
-
21
-
22
-
23
-
24
-
25
-
26
-
27
-
28
-
29
-
30
-
31
-
32
-
33
-
34
-
35
-
36
-
37
-
38
-
39
-
40
-
41
-
42
-
43
-
44
-
45
-
46
-
47
-
48
-
49
-
50
-
51
-
52
-
53
-
54
-
55
-
56
-
57
-
58
-
59
-
60
-
61
-
62
-
63
-
 64
64 -
 65
65 -
 66
66 -
 67
67 -
 68
68 -
 69
69 -
 70
70 -
 71
71 -
 72
72 -
 73
73 -
 74
74 -
 75
75 -
 76
76 -
 77
77 -
 78
78 -
 79
79 -
 80
80 -
 81
81 -
 82
82 -
 83
83 -
 84
84 -
85
-
86
-
87
-
88
-
89
-
90
-
91
-
92
-
93
-
94
-
95
-
96
-
97
-
98
-
99
-
100
-
101
-
102
-
103
-
104
-
105
-
106
-
107
-
108
-
109
-
110
-
111
-
112
-
113
-
114
-
115
-
116
-
117
-
118
-
119
-
120
-
121
-
122
-
123
-
124
-
125
-
126
-
127
-
128
-
129
-
130
-
131
-
132
-
133
-
134
-
135
-
136
-
137
-
138
-
139
-
140
-
141
-
142
 |
 |
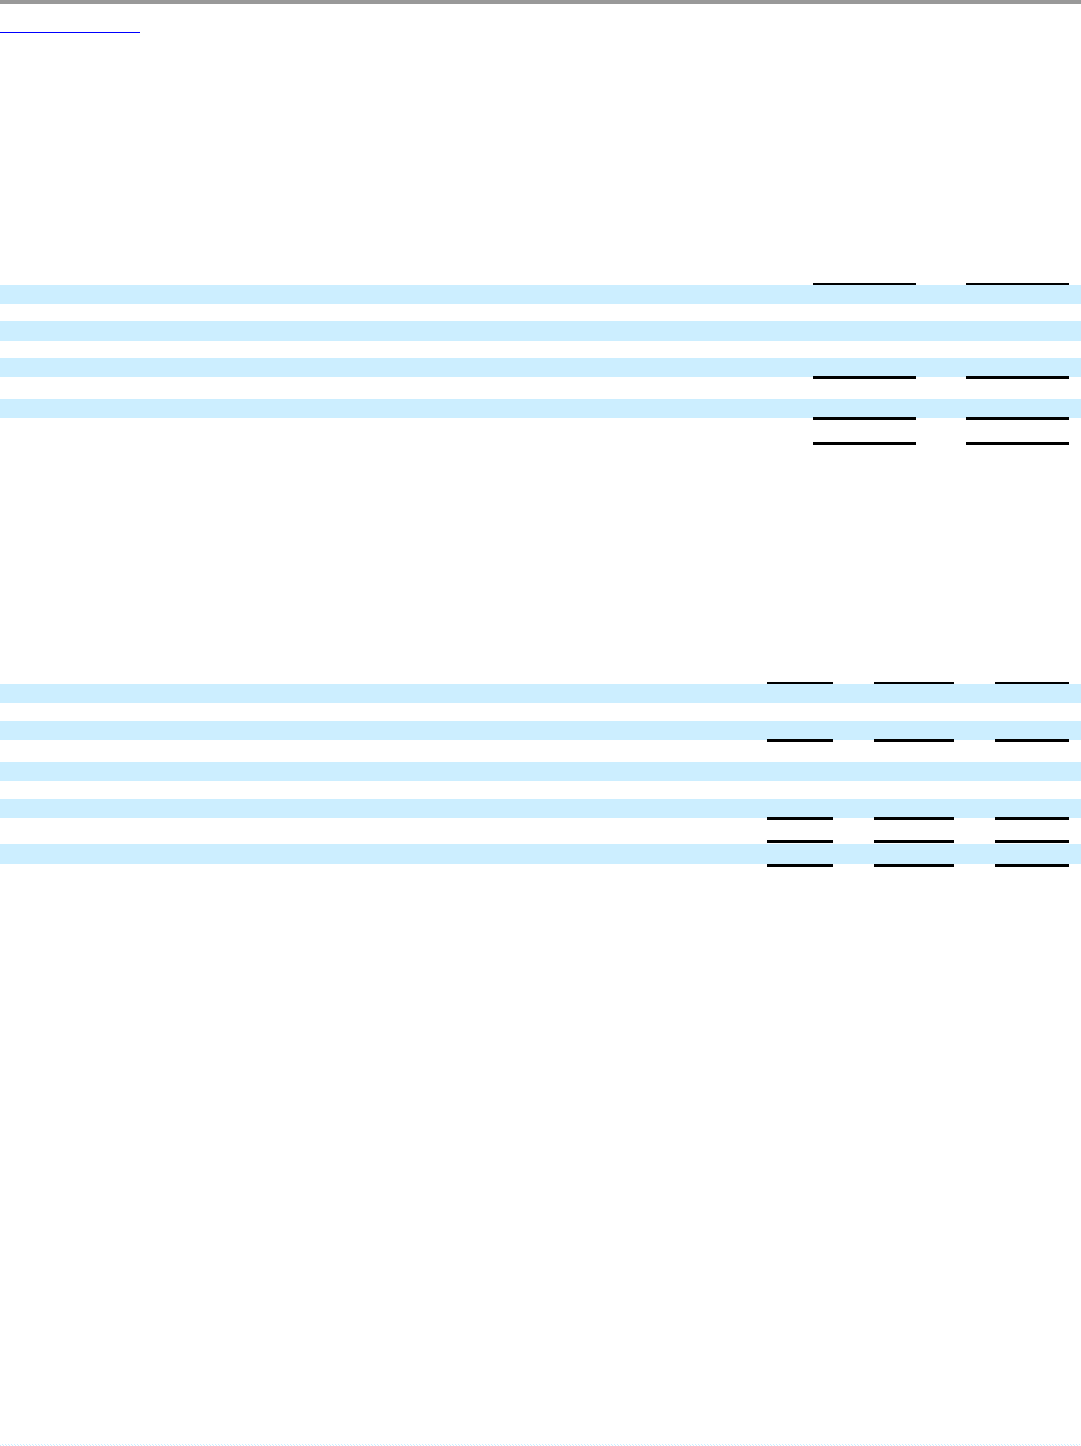
Table of Contents
SAKS INCORPORATED & SUBSIDIARIES
NOTES TO CONSOLIDATED FINANCIAL STATEMENTS—(Continued)
(In thousands, except per share amounts)
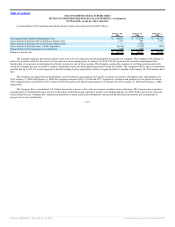
servicing compensation. For 2009, 2008, and 2007, the components of the credit contribution included in SG&A were $29,425, $29,899, and $28,754,
respectively.
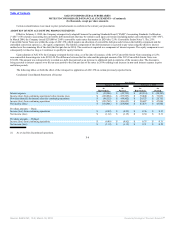
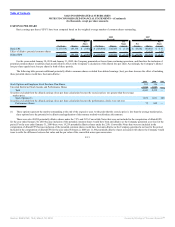
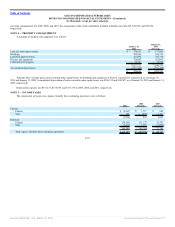
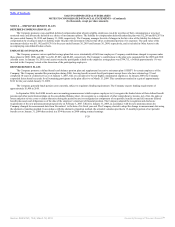
NOTE 4 — PROPERTY AND EQUIPMENT
A summary of property and equipment is as follows:
January 30,
2010
January 31,
2009
(Revised)
Land and land improvements $ 174,551 $ 177,069
Buildings 585,860 594,578
Leasehold improvements 321,092 341,319
Fixtures and equipment 734,847 811,642
Construction in progress 10,921 24,968
1,827,271 1,949,576
Accumulated depreciation (871,189) (891,183)
$ 956,082 $ 1,058,393
Amounts above include gross assets recorded under capital leases for buildings and equipment of $126,511 and $4,436, respectively as of January 30,
2010 and January 31, 2009. Accumulated depreciation of assets recorded under capital leases was $106,335 and $102,871 as of January 30, 2010 and January 31,
2009, respectively.
Depreciation expense was $135,135, $134,669, and $131,710 in 2009, 2008, and 2007, respectively.
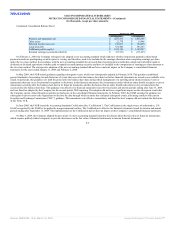
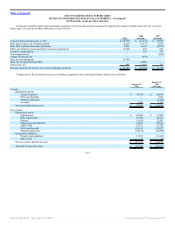
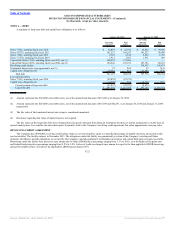
NOTE 5 — INCOME TAXES
The components of income tax expense (benefit) from continuing operations were as follows:
2009
2008
(Revised)
2007
(Revised)
Current:
Federal $ (4,261) $ 1,717 $ 826
State 345 (839) 2,141
(3,916) 878 2,967
Deferred:
Federal (34,266) (51,177) 25,593
State (6,319) 1,397 (1,805)
(40,585) (49,780) 23,788
Total expense (benefit) from continuing operations $ (44,501) $ (48,902) $ 26,755
F-18
Source: SAKS INC, 10-K, March 18, 2010 Powered by Morningstar® Document Research℠