Radio Shack 2009 Annual Report Download - page 86
Download and view the complete annual report
Please find page 86 of the 2009 Radio Shack annual report below. You can navigate through the pages in the report by either clicking on the pages listed below, or by using the keyword search tool below to find specific information within the annual report.-
 1
1 -
2
-
3
-
4
-
5
-
6
-
7
-
8
-
9
-
10
-
11
-
12
-
13
-
14
-
15
-
16
-
17
-
18
-
19
-
20
-
21
-
22
-
23
-
24
-
25
-
26
-
27
-
28
-
29
-
30
-
31
-
32
-
33
-
34
-
35
-
36
-
37
-
38
-
39
-
40
-
41
-
42
-
43
-
44
-
45
-
46
-
47
-
48
-
49
-
50
-
51
-
52
-
53
-
54
-
55
-
56
-
57
-
58
-
59
-
60
-
61
-
62
-
63
-
64
-
65
-
66
-
67
-
68
-
69
-
70
-
71
-
72
-
73
-
74
-
75
-
 76
76 -
 77
77 -
 78
78 -
 79
79 -
 80
80 -
 81
81 -
 82
82 -
 83
83 -
 84
84 -
 85
85 -
 86
86 -
 87
87 -
 88
88 -
 89
89 -
 90
90 -
 91
91 -
 92
92 -
 93
93 -
 94
94 -
 95
95 -
 96
96 -
97
 |
 |

79
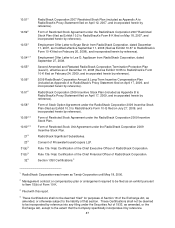
Product Sales Information: Our consolidated net sales and operating revenues are summarized by
groups of similar products and services, as follows:
Consolidated Net Sales and Operating Revenues
Year Ended December 31,
(In millions) 2009 2008 2007
Wireless $ 1,633.3 38.2% $ 1,387.3 32.8% $ 1,415.8 33.3%
Accessory 1,058.6 24.8 1,174.6 27.8 1,019.2 24.0
Modern home 561.0 13.1 531.8 12.6 557.1 13.1
Personal electronics 454.9 10.6 549.2 13.0 657.2 15.5
Power 227.6 5.3 244.9 5.8 251.7 5.9
Technical 181.1 4.2 184.6 4.4 185.5 4.4
Service 115.3 2.7 95.5 2.3 100.3 2.3
Other sales 44.2 1.1 56.6 1.3 64.9 1.5
Consolidated net sales and
operating revenues
$ 4,276.0
100.0%
$ 4,224.5
100.0%
$ 4,251.7
100.0%