Radio Shack 2009 Annual Report Download - page 4
Download and view the complete annual report
Please find page 4 of the 2009 Radio Shack annual report below. You can navigate through the pages in the report by either clicking on the pages listed below, or by using the keyword search tool below to find specific information within the annual report.-
 1
1 -
 2
2 -
 3
3 -
 4
4 -
 5
5 -
 6
6 -
 7
7 -
 8
8 -
 9
9 -
 10
10 -
 11
11 -
 12
12 -
 13
13 -
 14
14 -
 15
15 -
16
-
17
-
18
-
19
-
20
-
21
-
22
-
23
-
24
-
25
-
26
-
27
-
28
-
29
-
30
-
31
-
32
-
33
-
34
-
35
-
36
-
37
-
38
-
39
-
40
-
41
-
42
-
43
-
44
-
45
-
46
-
47
-
48
-
49
-
50
-
51
-
52
-
53
-
54
-
55
-
56
-
57
-
58
-
59
-
60
-
61
-
62
-
63
-
64
-
65
-
66
-
67
-
68
-
69
-
70
-
71
-
72
-
73
-
74
-
75
-
76
-
77
-
78
-
79
-
80
-
81
-
82
-
83
-
84
-
85
-
86
-
87
-
88
-
89
-
90
-
91
-
92
-
93
-
94
-
95
-
96
-
97
 |
 |
RADIOSHACK CORPORATION 1
(Dollars in millions, except per share amounts) 2007 2008 2009
Net sales and operating revenues $ 4,251.7 $ 4,224.5 $ 4,276.0
Comparable store sales (decrease) increase (8.2%) (0.6%) 1.3%
Gross profit as a percent of sales 47.6% 45.5% 45.9%
SG&A expense as a percent of sales 36.2% 35.7% 35.3%
Operating income $ 381.9 $ 322.2 $ 369.4
Operating income as a percent of sales 9.0% 7.6% 8.6%
Net income $ 236.8 $ 189.4 $ 205.0
Net income per share (diluted) $ 1.74 $ 1.47 $ 1.63
Cash and cash equivalents $ 509.7 $ 814.8 $ 908.2
Net cash(1) $ 100.3 $ 116.0 $ 238.8
Debt to total capitalization ratio(2) 34.7% 44.8% 39.0%
Cash dividends per share declared and paid $ 0.25 $ 0.25 $ 0.25
Number of retail locations at year end:
U.S. RadioShack company-operated stores 4,447 4,453 4,476
Kiosks 739 688 562
Mexico RadioShack company-operated stores — 200 204
Dealer and other outlets 1,484 1,411 1,321
Total 6,670 6,752 6,563
(1) Cash and cash equivalents less total debt.
(2) Represents total debt divided by total capitalization (total debt + total shareholders’ equity).
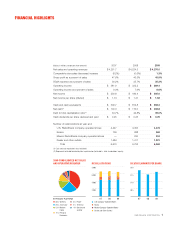
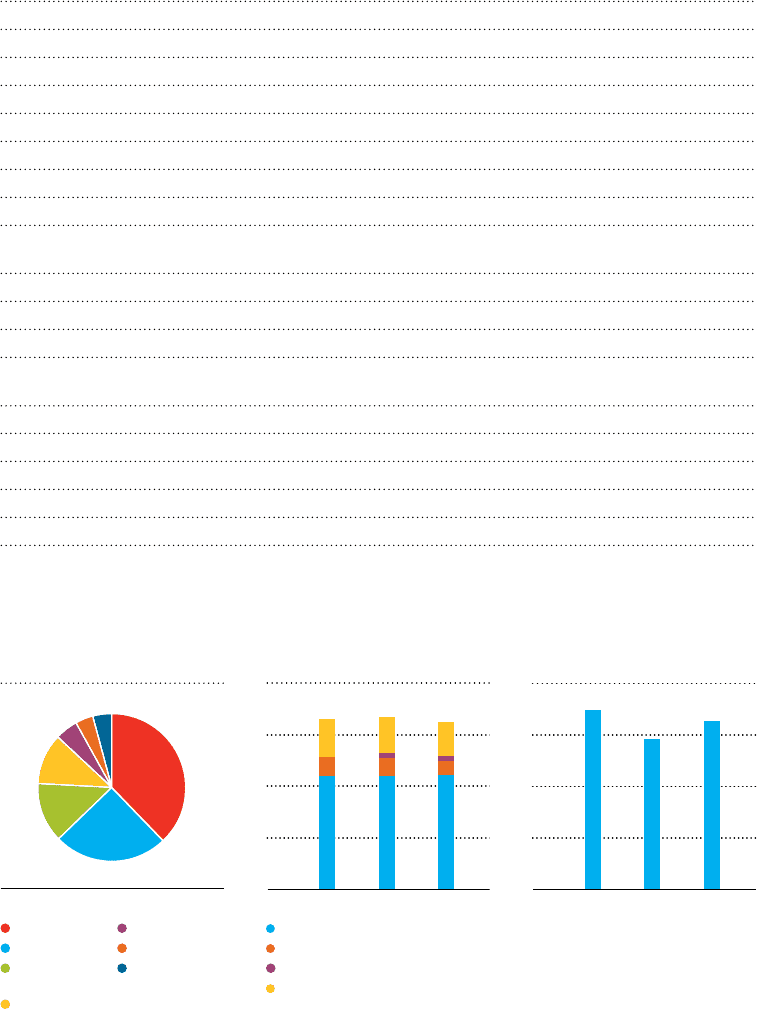
FINANCIAL HIGHLIGHTS
DILUTED EARNINGS PER SHARE
RETAIL LOCATIONS
2009 CONSOLIDATED NET SALES
AND OPERATING REVENUES
38% Wireless
25% Accessory
13% Modern
Home
11% Personal
Electronics
5% Power
4% Technical
4% Service and
all other
$0.5
$1.0
$1.5
$2.0
07 08 09
2,000
4,000
6,000
8,000
07 08 09
U.S. Company-Operated Stores
Kiosks
Mexico Company-Operated Stores
Dealer and Other Outlets
BY PRODUCT PLATFORM